

Answered step by step
Verified Expert Solution
Question
1 Approved Answer
I need to figure out the eva (economic value added) for all 3 countries. This is the formula my teacher lists: Economic Value Added =
I need to figure out the eva (economic value added) for all 3 countries. This is the formula my teacher lists:
Economic Value Added = Adjusted Income Cost of Capital (%) Adjusted Assets
Thank you for any help
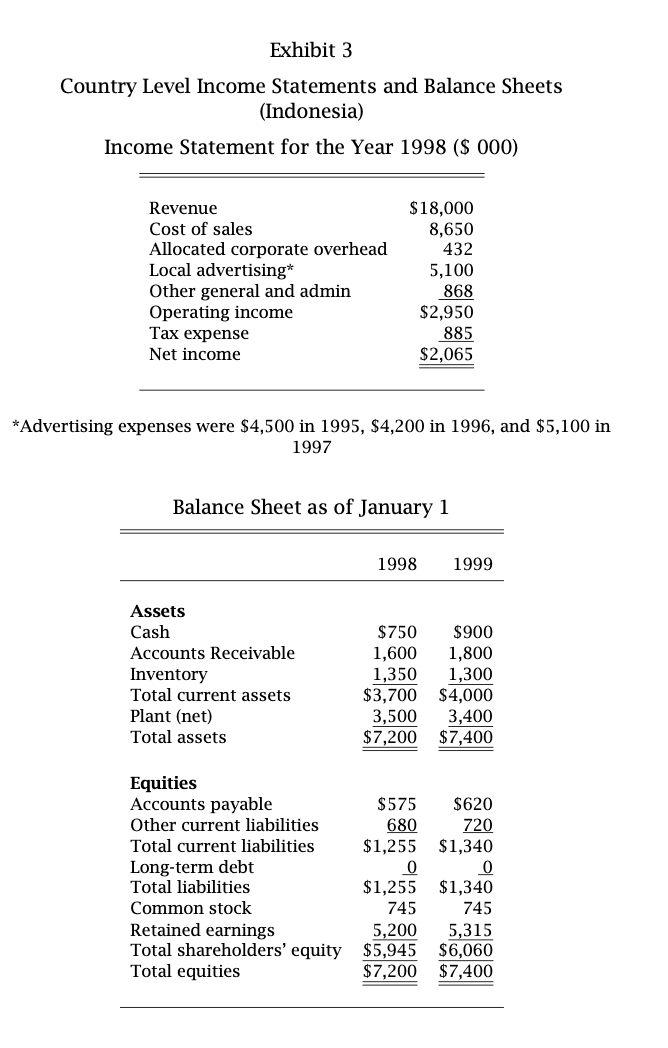
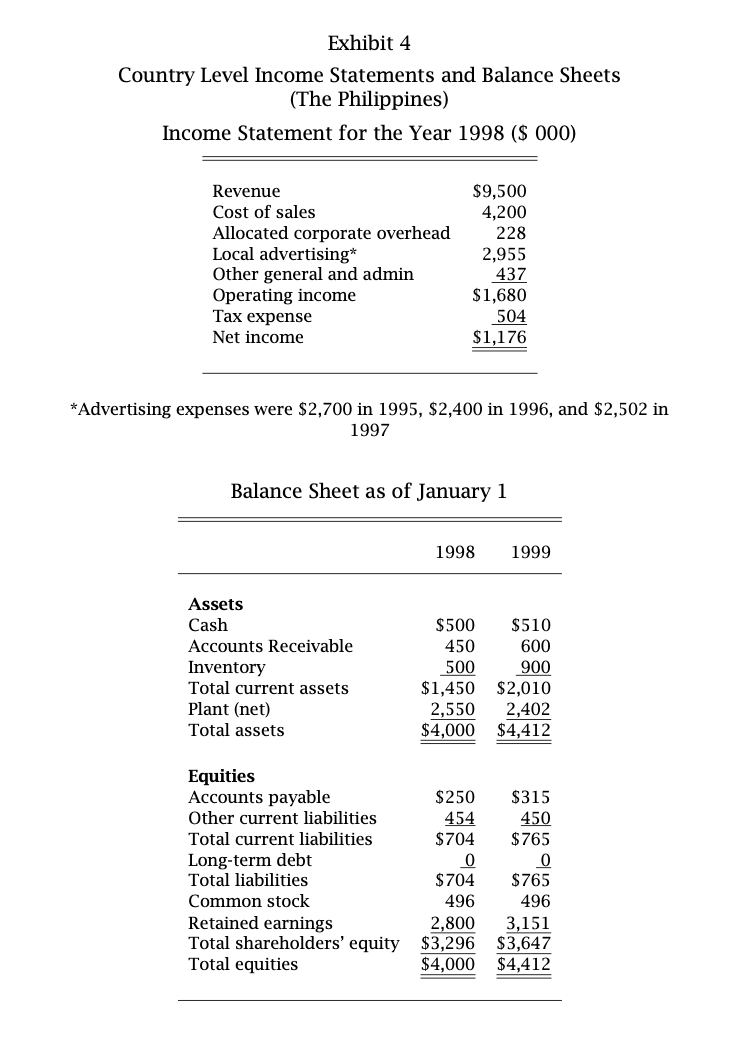
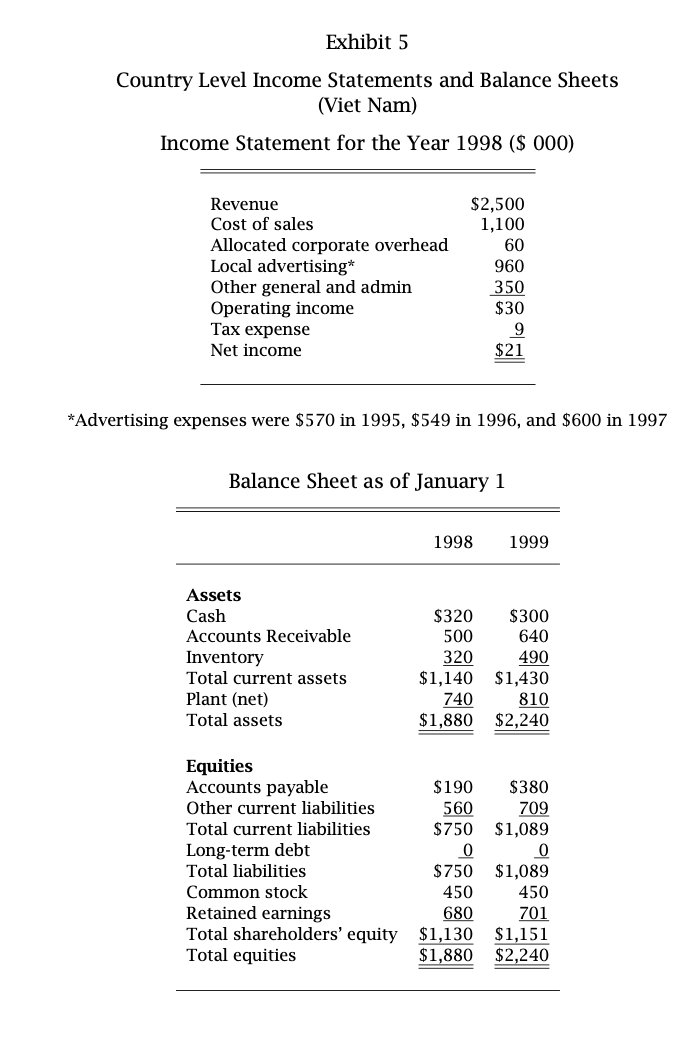
I also wonder whether Headquarters is looking at the right per- formance measure. I recently attended a seminar on new perfor- mance evaluation measures and the seminar speaker spent quite a bit of time on something called economic value added (EVAT). The way I understand it, EVATM adjusts profit first by eliminating distortions introduced by accounting rules and then subtracting a capital charge from the adjusted after-tax operating income. The capital charge is the cost of capital multiplied by the net assets (total assets less current liabilities) employed. I guess I would use the cost of capital of 20% after-tax that Corporate pol- icy requires I use for investment decisions. The problem I have is I am not sure how to adjust income, which is an accounting mea- sure, into something more meaningful. We don't do any R&D here, so the only item on our financial statements statements that was mentioned at the seminar is advertising. When I was working in the US, I came across a study stating that advertising expenditures in our industry have an expected life of about three years. If that's true, then clearly the way we account for adver- tising is wrong and I should adjust these results accordingly. Some of this confusion, of course, would probably go away if I had more of a financial background. There are other issues, though, that I think are more ambiguous. For one thing, Binh developed a new approach to delivering products that really cut the distribution costs two years ago. At an annual retreat, he worked with both Ade and Isadore on how they could adapt his innovation to their markets. As a result, their distribution costs are much lower this year. I don't know how any performance measurement system can incorporate that kind of information. At the same time, Binh tells me that many of his customers are being supplied from warehouses in Indonesia and so Ade gets credit for it. We don't have a solid quantitative measure of this yet, but I will need to factor this in when I repeat the analysis next year. Exhibit 3 Country Level Income Statements and Balance Sheets (Indonesia) Income Statement for the Year 1998 ($ 000) Revenue Cost of sales Allocated corporate overhead Local advertising* Other general and admin Operating income Tax expense Net income $18,000 8,650 432 5,100 868 $2,950 885 $2,065 *Advertising expenses were $4,500 in 1995, $4,200 in 1996, and $5,100 in 1997 Balance Sheet as of January 1 1998 1999 Assets Cash Accounts Receivable Inventory Total current assets Plant (net) Total assets $750 1,600 1,350 $3,700 3,500 $7,200 $900 1,800 1,300 $4,000 3,400 $7,400 $575 680 $1,255 0 Equities Accounts payable Other current liabilities Total current liabilities Long-term debt Total liabilities Common stock Retained earnings Total shareholders' equity Total equities $1,255 745 5,200 $5,945 $7,200 $620 720 $1,340 0 $1,340 745 5,315 $6,060 $7,400 Exhibit 4 Country Level Income Statements and Balance Sheets (The Philippines) Income Statement for the Year 1998 ($ 000) Revenue Cost of sales Allocated corporate overhead Local advertising* Other general and admin Operating income Tax expense Net income $9,500 4,200 228 2,955 437 $1,680 504 $1,176 *Advertising expenses were $2,700 in 1995, $2,400 in 1996, and $2,502 in 1997 Balance Sheet as of January 1 1998 1999 Assets Cash Accounts Receivable Inventory Total current assets Plant (net) Total assets $500 450 500 $1,450 2,550 $4,000 $510 600 900 $2,010 2,402 $4,412 Equities Accounts payable Other current liabilities Total current liabilities Long-term debt Total liabilities Common stock Retained earnings Total shareholders' equity Total equities $250 454 $704 0 $704 496 2.800 $3,296 $4,000 $315 450 $765 0 $765 496 3,151 $3,647 $4,412 Exhibit 5 Country Level Income Statements and Balance Sheets (Vit Nam) Income Statement for the Year 1998 ($ 000) $2,500 1,100 60 Revenue Cost of sales Allocated corporate overhead Local advertising* Other general and admin Operating income Tax expense Net income 960 350 $30 9 $21 *Advertising expenses were $570 in 1995, $549 in 1996, and $600 in 1997 Balance Sheet as of January 1 1998 1999 Assets Cash Accounts Receivable Inventory Total current assets Plant (net) Total assets $320 $300 500 640 320 490 $1,140 $1,430 740810 $1,880 $2,240 $190 560 $750 Equities Accounts payable Other current liabilities Total current liabilities Long-term debt Total liabilities Common stock Retained earnings Total shareholders' equity Total equities $380 709 $1,089 0 $1,089 0 450 $750 450 680 $1,130 $1,880 701 $1,151 $2,240 I also wonder whether Headquarters is looking at the right per- formance measure. I recently attended a seminar on new perfor- mance evaluation measures and the seminar speaker spent quite a bit of time on something called economic value added (EVAT). The way I understand it, EVATM adjusts profit first by eliminating distortions introduced by accounting rules and then subtracting a capital charge from the adjusted after-tax operating income. The capital charge is the cost of capital multiplied by the net assets (total assets less current liabilities) employed. I guess I would use the cost of capital of 20% after-tax that Corporate pol- icy requires I use for investment decisions. The problem I have is I am not sure how to adjust income, which is an accounting mea- sure, into something more meaningful. We don't do any R&D here, so the only item on our financial statements statements that was mentioned at the seminar is advertising. When I was working in the US, I came across a study stating that advertising expenditures in our industry have an expected life of about three years. If that's true, then clearly the way we account for adver- tising is wrong and I should adjust these results accordingly. Some of this confusion, of course, would probably go away if I had more of a financial background. There are other issues, though, that I think are more ambiguous. For one thing, Binh developed a new approach to delivering products that really cut the distribution costs two years ago. At an annual retreat, he worked with both Ade and Isadore on how they could adapt his innovation to their markets. As a result, their distribution costs are much lower this year. I don't know how any performance measurement system can incorporate that kind of information. At the same time, Binh tells me that many of his customers are being supplied from warehouses in Indonesia and so Ade gets credit for it. We don't have a solid quantitative measure of this yet, but I will need to factor this in when I repeat the analysis next year. Exhibit 3 Country Level Income Statements and Balance Sheets (Indonesia) Income Statement for the Year 1998 ($ 000) Revenue Cost of sales Allocated corporate overhead Local advertising* Other general and admin Operating income Tax expense Net income $18,000 8,650 432 5,100 868 $2,950 885 $2,065 *Advertising expenses were $4,500 in 1995, $4,200 in 1996, and $5,100 in 1997 Balance Sheet as of January 1 1998 1999 Assets Cash Accounts Receivable Inventory Total current assets Plant (net) Total assets $750 1,600 1,350 $3,700 3,500 $7,200 $900 1,800 1,300 $4,000 3,400 $7,400 $575 680 $1,255 0 Equities Accounts payable Other current liabilities Total current liabilities Long-term debt Total liabilities Common stock Retained earnings Total shareholders' equity Total equities $1,255 745 5,200 $5,945 $7,200 $620 720 $1,340 0 $1,340 745 5,315 $6,060 $7,400 Exhibit 4 Country Level Income Statements and Balance Sheets (The Philippines) Income Statement for the Year 1998 ($ 000) Revenue Cost of sales Allocated corporate overhead Local advertising* Other general and admin Operating income Tax expense Net income $9,500 4,200 228 2,955 437 $1,680 504 $1,176 *Advertising expenses were $2,700 in 1995, $2,400 in 1996, and $2,502 in 1997 Balance Sheet as of January 1 1998 1999 Assets Cash Accounts Receivable Inventory Total current assets Plant (net) Total assets $500 450 500 $1,450 2,550 $4,000 $510 600 900 $2,010 2,402 $4,412 Equities Accounts payable Other current liabilities Total current liabilities Long-term debt Total liabilities Common stock Retained earnings Total shareholders' equity Total equities $250 454 $704 0 $704 496 2.800 $3,296 $4,000 $315 450 $765 0 $765 496 3,151 $3,647 $4,412 Exhibit 5 Country Level Income Statements and Balance Sheets (Vit Nam) Income Statement for the Year 1998 ($ 000) $2,500 1,100 60 Revenue Cost of sales Allocated corporate overhead Local advertising* Other general and admin Operating income Tax expense Net income 960 350 $30 9 $21 *Advertising expenses were $570 in 1995, $549 in 1996, and $600 in 1997 Balance Sheet as of January 1 1998 1999 Assets Cash Accounts Receivable Inventory Total current assets Plant (net) Total assets $320 $300 500 640 320 490 $1,140 $1,430 740810 $1,880 $2,240 $190 560 $750 Equities Accounts payable Other current liabilities Total current liabilities Long-term debt Total liabilities Common stock Retained earnings Total shareholders' equity Total equities $380 709 $1,089 0 $1,089 0 450 $750 450 680 $1,130 $1,880 701 $1,151 $2,240Step by Step Solution
There are 3 Steps involved in it
Step: 1

Get Instant Access to Expert-Tailored Solutions
See step-by-step solutions with expert insights and AI powered tools for academic success
Step: 2

Step: 3
Ace Your Homework with AI
Get the answers you need in no time with our AI-driven, step-by-step assistance
Get Started
Shrimply Inflation
Authors: Eiche Gardner
1st Edition
B0BYLXHYCY, 979-8386901233