

Question
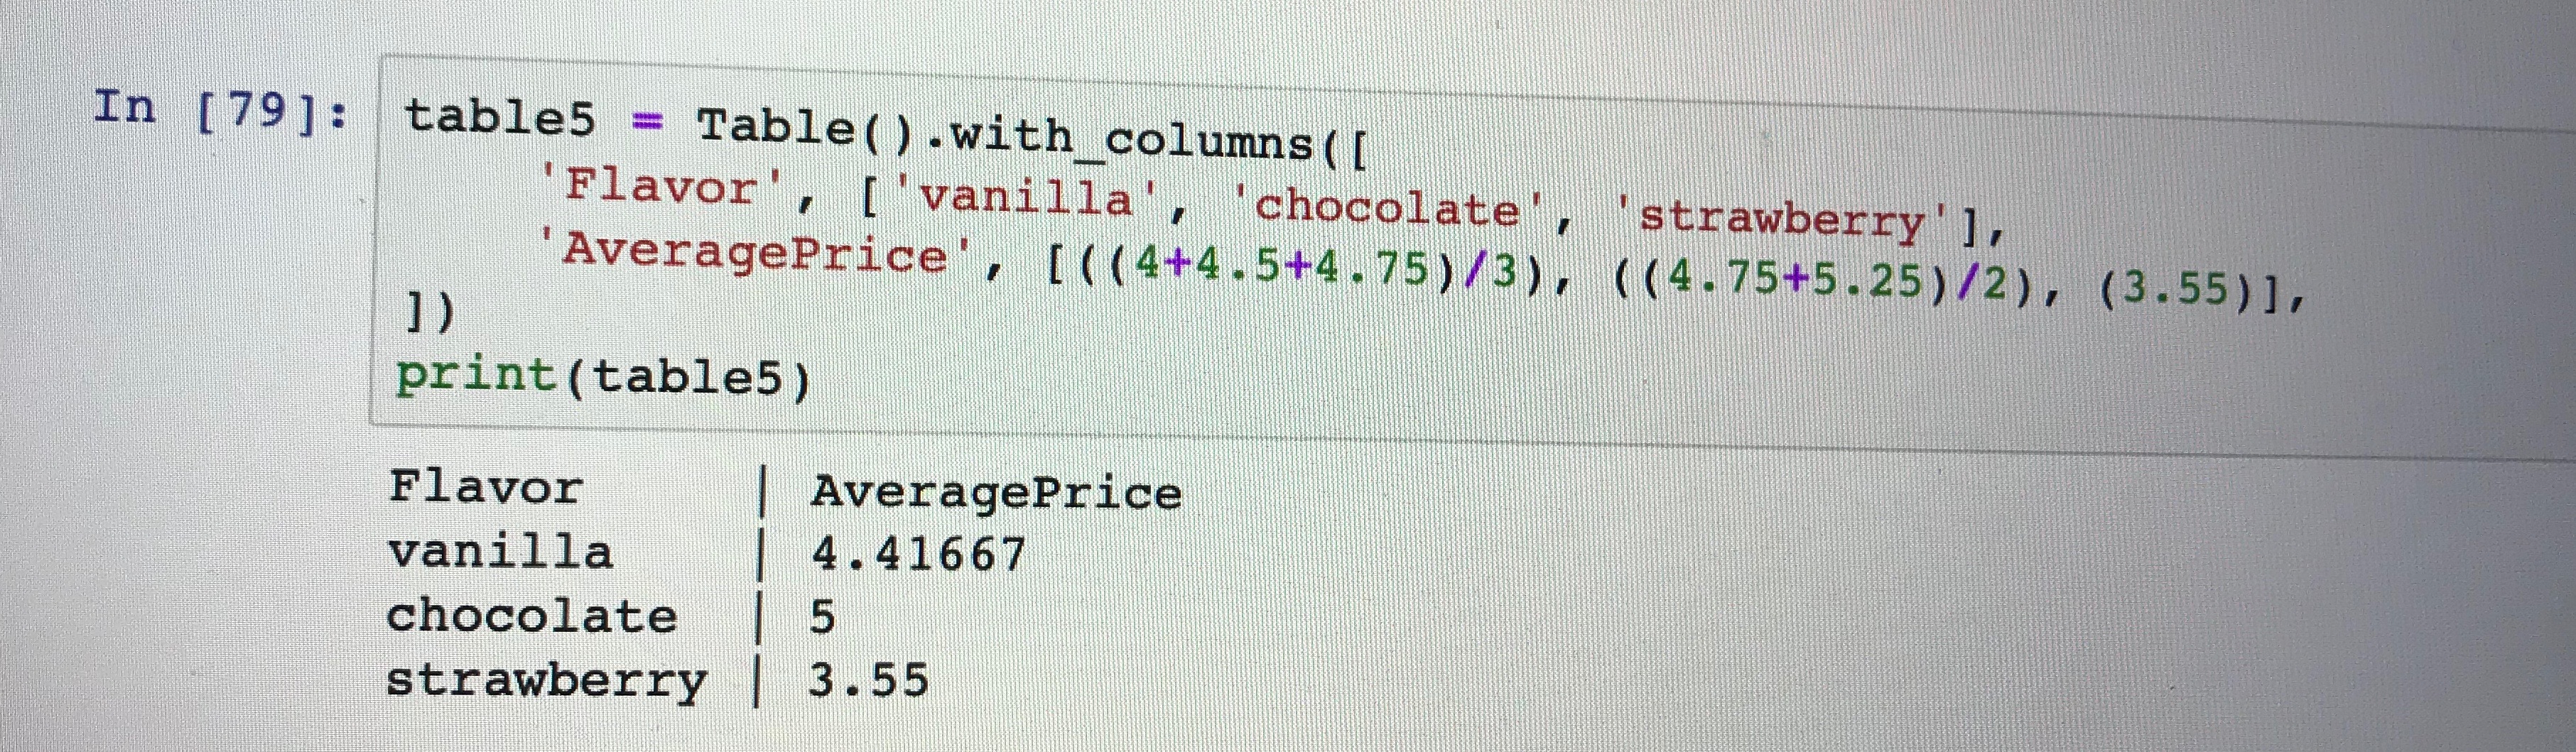
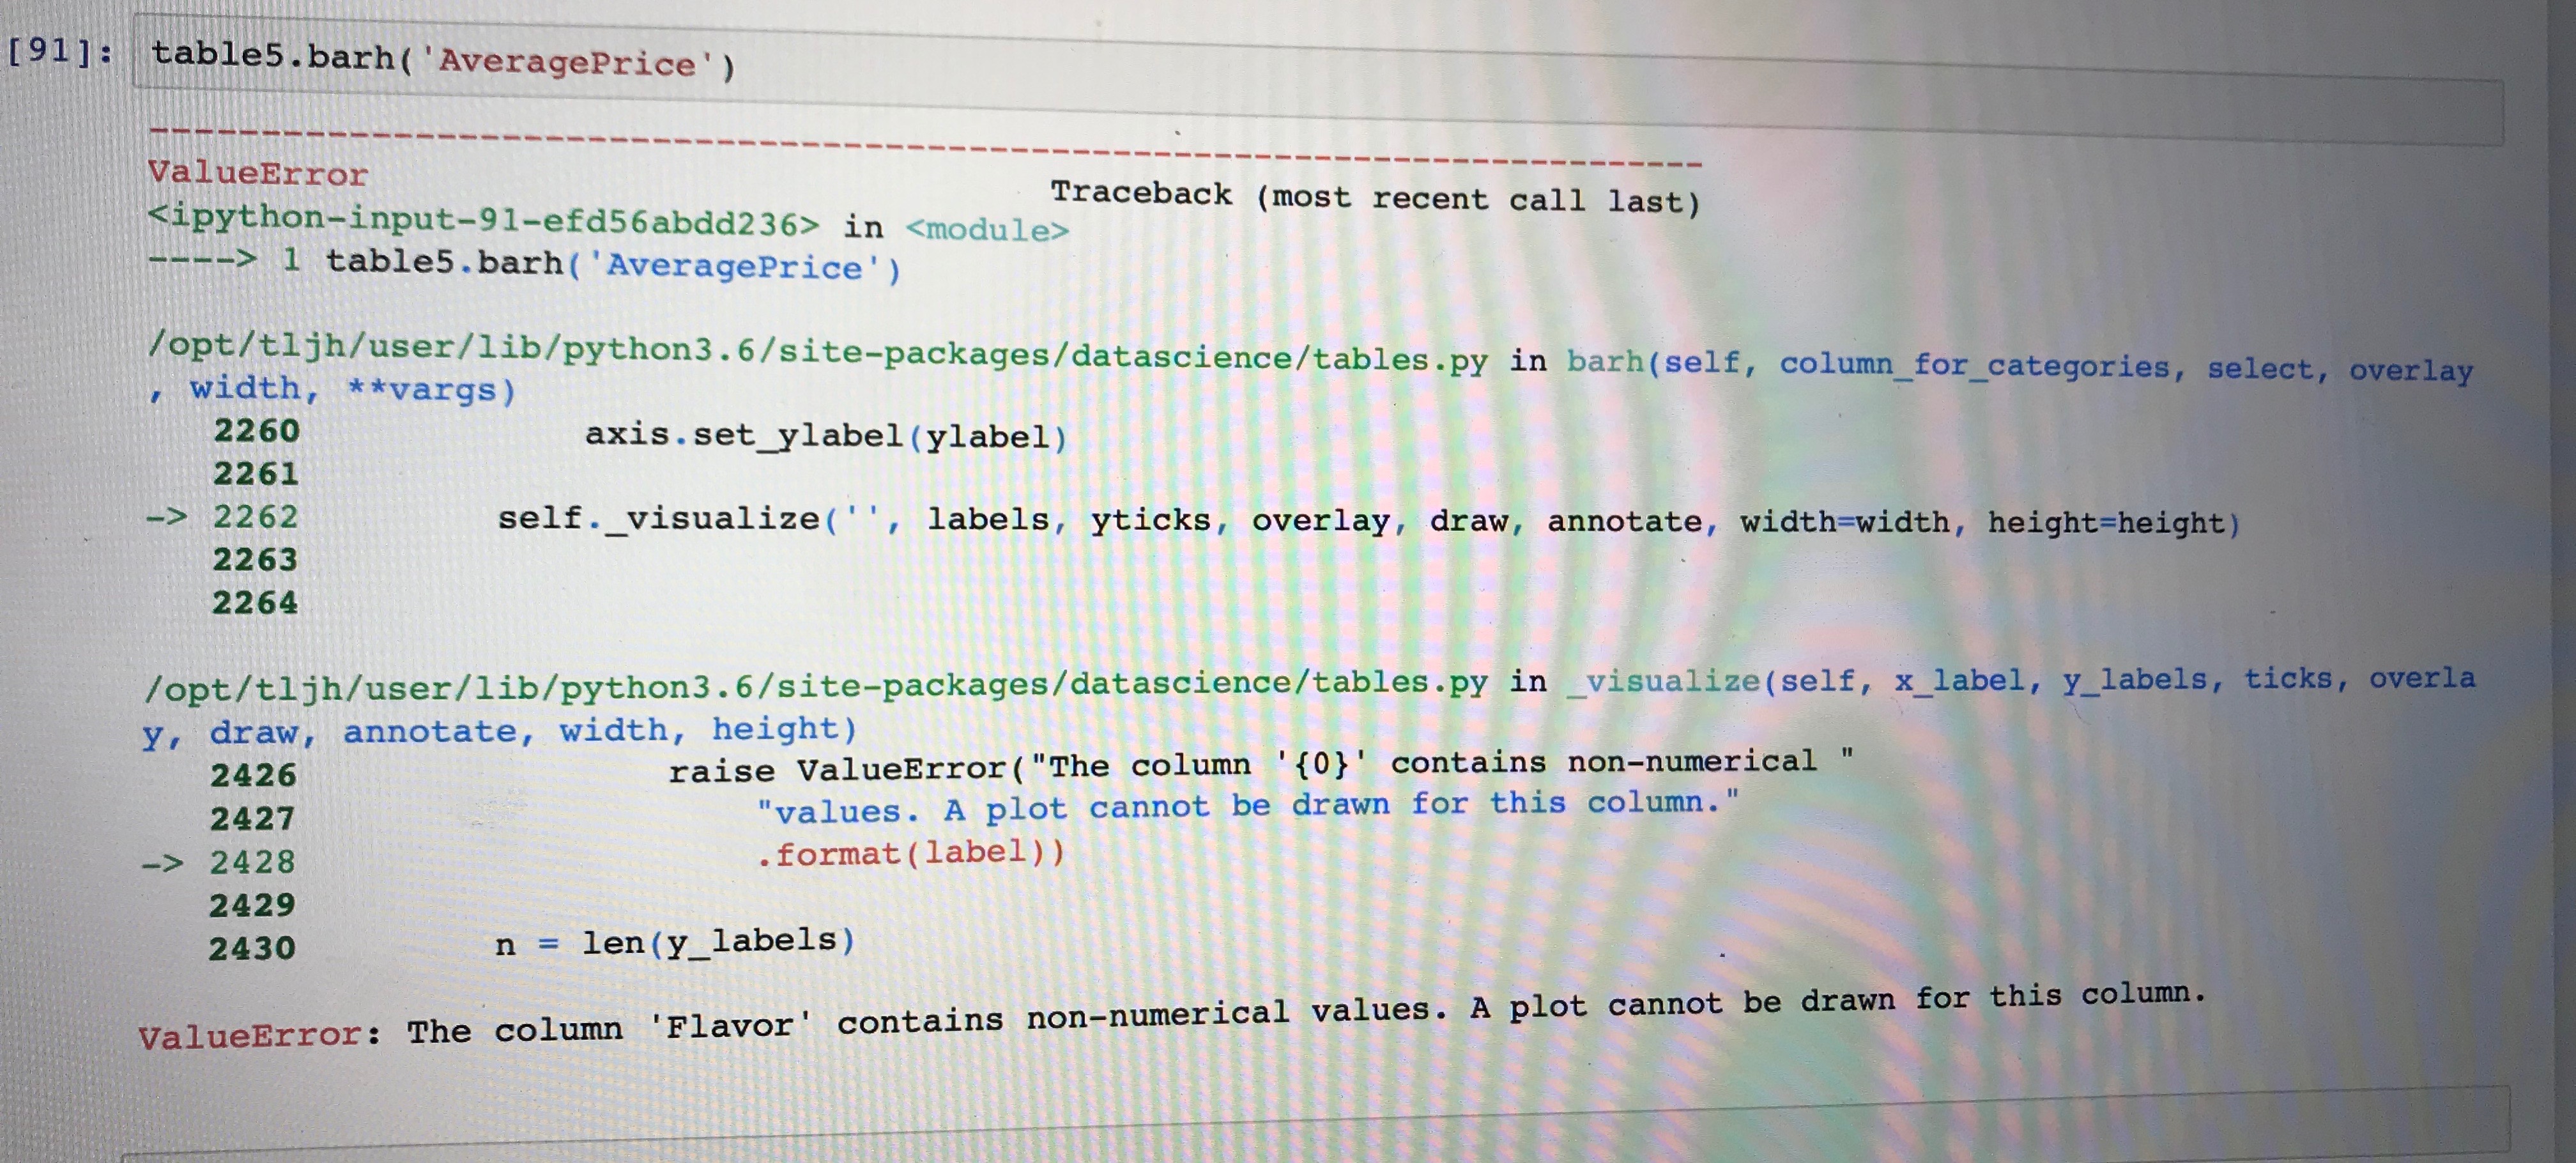
I need to produce a horizontal bar chart using the columns AveragePrice and Flavors (columns from table5). I type in table5.barh('AveragePrice') but it tells me
I need to produce a horizontal bar chart using the columns "AveragePrice" and "Flavors" (columns from table5). I type in table5.barh('AveragePrice') but it tells me that the Flavor cannot be plotted because they are nonnumerical values. What is another way to produce this horizontal bar graph?
Step by Step Solution
There are 3 Steps involved in it
Step: 1

Get Instant Access to Expert-Tailored Solutions
See step-by-step solutions with expert insights and AI powered tools for academic success
Step: 2

Step: 3
Ace Your Homework with AI
Get the answers you need in no time with our AI-driven, step-by-step assistance
Get Started
Modern Dental Assisting
Authors: Doni Bird, Debbie Robinson
13th Edition
978-0323624855, 0323624855