I need to project the incremental, annual, and cumulative cash benefits and outflows associated with the proposed expansion for the next seven to 10 years, using a spreadsheet or other relevant presentation vehicle to support your narrative. Be sure to justify your assumptions and methodology based on sound microeconomic and financial principles. For example, what assumptions have you made about demand, price, volume, capital purchase costs, incremental hiring, and so on?
The company is Alteryx: I was able to get as far as incremental...but I am stuck with the rest.
The assumption used for the growth rate is 7.3% annually
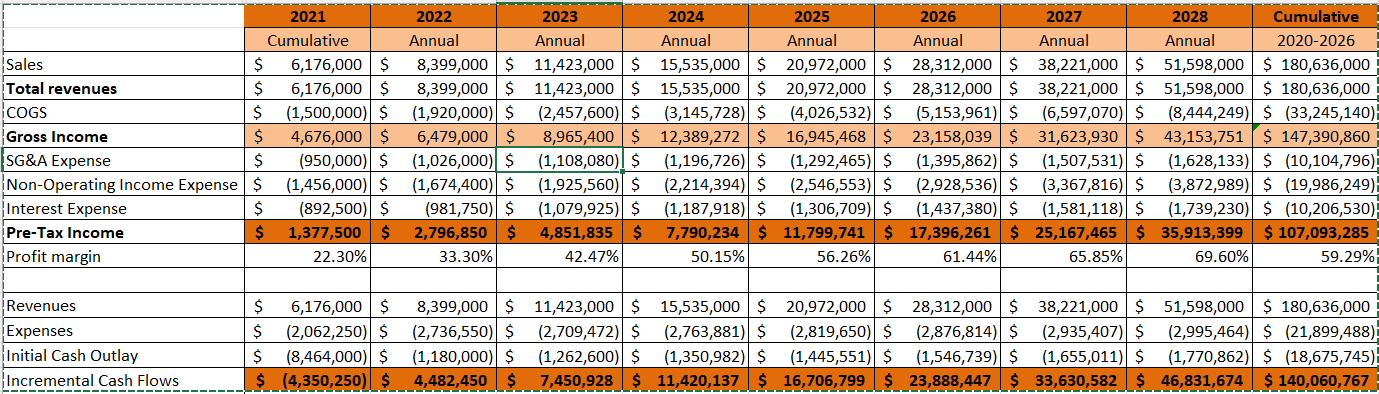
2021 Cumulative Sales $ 6,176,000 $ Total revenues $ 6,176,000 $ COGS $ (1,500,000) $ Gross Income $ 4,676,000 $ SG&A Expense $ (950,000) $ Non-Operating Income Expense $ (1,456,000) $ Interest Expense $ (892,500) $ Pre-Tax Income $ 1,377,500 $ Profit margin 22.30% 2022 2023 2024 2025 2026 2027 2028 Cumulative Annual Annual Annual Annual Annual Annual Annual 2020-2026 8,399,000 $ 11,423,000 $ 15,535,000 $ 20,972,000 $ 28,312,000 $ 38,221,000 $ 51,598,000 $ 180,636,000 8,399,000 $ 11,423,000 $ 15,535,000 $ 20,972,000 $ 28,312,000 $ 38,221,000 $ 51,598,000 $ 180,636,000 (1,920,000) $ (2,457,600) $ (3,145,728) $ (4,026,532) $ (5,153,961) $ (6,597,070) $ (8,444,249) $ (33,245,140) 6,479,000 $ 8,965,400 $ 12,389,272$ 16,945,468$ 23,158,039 $ 31,623,930$ 43,153,751 $ 147,390,860 (1,026,000) $ (1,108,080)| $ (1,196,726) $ (1,292,465) $ (1,395,862) $ (1,507,531) $ (1,628,133) $ (10,104,796) (1,674,400) $ (1,925,560) $ (2,214,394) $ (2,546,553) $ (2,928,536) $ (3,367,816) $ (3,872,989) $ (19,986,249) (981,750) $ (1,079,925) $ (1,187,918) $ (1,306,709) $ (1,437,380) $ (1,581,118) $ (1,739,230) $ (10,206,530) 2,796,850 $ 4,851,835 $ 7,790,234 $ 11,799,741 $ 17,396,261 $ 25,167,465 $ 35,913,399 $ 107,093,285 33.30% 42.47% 50.15% 56.26% 61.44% 65.85% 69.60% 59.29% Revenues Expenses Initial Cash Outlay Incremental Cash Flows $ 6,176,000 $ $ (2,062,250) $ $ (8,464,000) $ $ (4,350,250) $ 8,399,000 $ 11,423,000$ 15,535,000 $ 20,972,000 $ 28,312,000 $ 38,221,000 $ (2,736,550) $ (2,709,472) $ (2,763,881) $ (2,819,650) $ (2,876,814) $ (2,935,407) $ (1,180,000) $ (1,262,600) $ (1,350,982) $ (1,445,551) $ (1,546,739) $ (1,655,011) $ 4,482,450 $ 7,450,928 $ 11,420,137 $ 16,706,799 $ 23,888,447 $ 33,630,582 $ 51,598,000 $ 180,636,000 (2,995,464) $ (21,899,488) (1,770,862) $ (18,675,745) 46,831,674 $ 140,060,767 2021 Cumulative Sales $ 6,176,000 $ Total revenues $ 6,176,000 $ COGS $ (1,500,000) $ Gross Income $ 4,676,000 $ SG&A Expense $ (950,000) $ Non-Operating Income Expense $ (1,456,000) $ Interest Expense $ (892,500) $ Pre-Tax Income $ 1,377,500 $ Profit margin 22.30% 2022 2023 2024 2025 2026 2027 2028 Cumulative Annual Annual Annual Annual Annual Annual Annual 2020-2026 8,399,000 $ 11,423,000 $ 15,535,000 $ 20,972,000 $ 28,312,000 $ 38,221,000 $ 51,598,000 $ 180,636,000 8,399,000 $ 11,423,000 $ 15,535,000 $ 20,972,000 $ 28,312,000 $ 38,221,000 $ 51,598,000 $ 180,636,000 (1,920,000) $ (2,457,600) $ (3,145,728) $ (4,026,532) $ (5,153,961) $ (6,597,070) $ (8,444,249) $ (33,245,140) 6,479,000 $ 8,965,400 $ 12,389,272$ 16,945,468$ 23,158,039 $ 31,623,930$ 43,153,751 $ 147,390,860 (1,026,000) $ (1,108,080)| $ (1,196,726) $ (1,292,465) $ (1,395,862) $ (1,507,531) $ (1,628,133) $ (10,104,796) (1,674,400) $ (1,925,560) $ (2,214,394) $ (2,546,553) $ (2,928,536) $ (3,367,816) $ (3,872,989) $ (19,986,249) (981,750) $ (1,079,925) $ (1,187,918) $ (1,306,709) $ (1,437,380) $ (1,581,118) $ (1,739,230) $ (10,206,530) 2,796,850 $ 4,851,835 $ 7,790,234 $ 11,799,741 $ 17,396,261 $ 25,167,465 $ 35,913,399 $ 107,093,285 33.30% 42.47% 50.15% 56.26% 61.44% 65.85% 69.60% 59.29% Revenues Expenses Initial Cash Outlay Incremental Cash Flows $ 6,176,000 $ $ (2,062,250) $ $ (8,464,000) $ $ (4,350,250) $ 8,399,000 $ 11,423,000$ 15,535,000 $ 20,972,000 $ 28,312,000 $ 38,221,000 $ (2,736,550) $ (2,709,472) $ (2,763,881) $ (2,819,650) $ (2,876,814) $ (2,935,407) $ (1,180,000) $ (1,262,600) $ (1,350,982) $ (1,445,551) $ (1,546,739) $ (1,655,011) $ 4,482,450 $ 7,450,928 $ 11,420,137 $ 16,706,799 $ 23,888,447 $ 33,630,582 $ 51,598,000 $ 180,636,000 (2,995,464) $ (21,899,488) (1,770,862) $ (18,675,745) 46,831,674 $ 140,060,767