I need to provide a brief critical assesemnt of this following experiment. There are 8 topics that have been discussed which have been posted below in images.
This experiment/ study has atleast one flaw and possibly more than one. The critical assesment should identify and explain the flaws. We do not have to "redesign" the experiment.
Experiment: Pea Based protien as a meat substitute- acceptability trial
Pea based protein as a meat substitute - acceptability trial Plant (pea) based protein, and its use as a meat substitute has gained significant attention in recent years. As more plant-based products enter the market, success in an increasingly saturated market is contingent on them being accepted by a wide variety of consumers, not just vegetarians/vegans. One of the criticisms of the recent wave of products like 'Beyond meat burgers' is that the products contain relatively high quantities of salt and other processed ingredients. As part of an attempt to determine how to make these products more acceptable to consumers, an acceptability trial of three new products was performed. Each of the three new products featured reduced salt and fewer processed ingredients than current market offerings (all products being ground beef substitutes).
All participants in the trial were volunteers who replied to an email sent to all staff and students in the Faculty of Agricultural and Food Science. Prior to participating in the trial all participants are asked to complete short questionnaire (obligate diet restrictions and allergies?, voluntary diet restrictions) to ensure no harm would come to any of the participants.
Each trail consisted of 6 volunteers + the supervisor at a table taste testing each of the new products, as well as the top selling product currently on the market. The order that the products were consumed in was randomized per trial, but all 6 participants tried the same product at the same time. After participants tasted each product, the supervisor asked each participant to rate it based on 4 different criteria (taste, texture, smell, appearance) on a 1-5 scale with 5 being best and 1 being worst. The order that the participants responded in was randomized for each product. The supervisor was responsible for recording all responses to ensure consistency
A total of 5 trials were completed, one per day, for a total of 30 participants. The resulting information was used to help inform future recipe changes in the new products with the goal of improving product success upon launch.
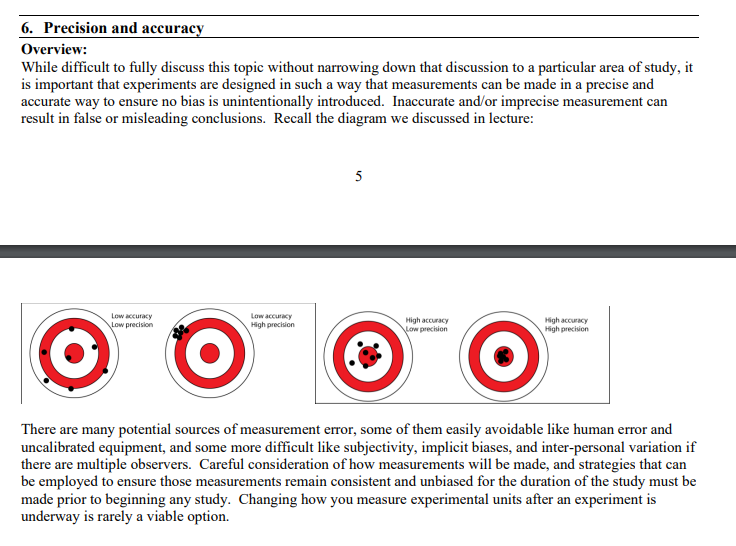
1. Randomization Overview: Most statistical analyses require data to be random, meaning that every individual in a population has an equal chance of being included in a sample. A random sample is expected to be representative of the entire population. This fundamental assumption is straightforward in theory but can be challenging in practice. Furthermore, randomization generally occurs at multiple stages of the experimental design and measurement stages of any experiment or survey. Correct application of randomization procedures often takes more time than carrying out experiments in a systematic way, but it is critically important and should never be ignored to save time! Humans often think they are able to randomize by simply choosing or measuring in a haphazard manner, but they cannot for a variety of reasons. Without using some sort of aid that takes decisions out of our hands (i.e a random number table or drawing numbers out of a hat), the eventual results of a study may be incorrect simply due to a lack of random selection of samples, and undetectable biases that it introduces. Computers also have problems creating truly random sets of numbers since the functions they use to generate sets of numbers have a starting 'seed', but for this course we will assume the random numbers generated in Excel or R are equivalent to those from any other random number table. >> Watch the randomization methods video . Also available as a pdf in the lab 2 folder5. Confounding factors and strategies to address them Overview: Any time more than one variable may be responsible for the result you obtain (and you cannot determine which variable matters), your data is confounded. The presence of confounding factors erodes one's ability to determine cause an effect and may lead to incorrect study conclusions. A plant or soil scientist, an animal scientist and a dietician or food scientist will all have to design experiments or surveys that avoid confounding factors, but the types of confounds they must avoid might be quite different. What follows is an attempt to briefly summarize the general categories of potential confounding factors that should be considered when designing experiments. Confounds in space Spatial confounds may occur when an environmental variable is unequally represented between subject/treatments and may sometimes occur even if proper randomization occurs. . For example, if most of your control plots end up in the lower elevation portions of a field and most of your amended plots end up in higher elevation portions of the field, you will have a confound that makes it impossible to determine if the result you obtained was due to the amendment or the elevation. Confounds in space are not limited to agricultural field studies, anytime treatments have a spatial arrangement/aspect to them, careful consideration must be made to ensure no confounds are introduced. Known spatial variation can often be adequately addressed by using stratification (blocking), see below. Confounds in time Temporal confounds may occur when the sequence of measuring replicates introduces biases. All measurements of subjects/experimental units should occur in a randomized sequence to avoid confounds associated with the passage of time. For anyone working in a podded canola field, the last thing you may want to do is walk through the field multiple times visiting sample plots in a random order, but this is critical to obtaining non- confounded results. The same is true if measuring animal weights. It would be most efficient to weight each animal in order based on their cage sequence, but again that would introduce a confound. Placebo effect Even survey responses may change based on time of day, hunger levels, etc. There are psychological effects which complicate the effects of treatments on people. In medicine (and related fields), there is a tendency for people to get better because they think that something is being done about their complaint. So when, for example, you give someone a pain relief drug there are two effects at work, a chemical effect of the drug and a psychological boost. Hawthorne effect In studies of people (and possibly some animals), the actual process of measuring or observing people changes their behavior and can confound results This can lead detection of an experimental effect in the direction expected but not for the reason expected, because the participants know they are being studied in connection with the outcomes measured Lack of randomization/independence of respondents/participants/replicates in surveys or natural experiments This category represents a catch all for other potential sources of confounds, best exemplified by asking several questions. o Are the voluntary respondents/participants in a study or survey actually a random, representative sample of the target population? O What (undetectable) biases might be introduced by the willingness of a certain section of the population to respond to surveys or sign up for studies, and what information should be collected to help the researcher try to determine those biases? O Are replicates in your natural experiment truly independent if you did not experimentally manipulate them?'3'. Ethical considerations Dvorview: Animal and human ethics considerations are central to some elds of study within agricultural and food sciences. Receiving approval from the respective research ethics board requires submission of detailed experimentallsurvey designs that document how the researcher will ensure minimal risk, the welfarefwellbeing {3 Rs} of test subjects, and in the case of humans, informed consent, privacy, and condentiality. For studies involving animals, the CCAC has a selfassessment style worksheet for compiling three Rs related information [b_tlp:-"rs.ccac.cat'documentsl'en-\"Animal use mussel worksheetdoc]. For human studies, the following UM protocol form lists all of the different considerations that must be made prior to submitting a request for approval thngmnanitobacafressarchforsetmsdtatgmcol submission fungi]. Approval times for research ethics submissions range from weeks to months, so it is critically important that you get it right the rst time, particularly if you need to complete a study by a particular date! lEtnce approved, experimental protocols approved by the respective ethics board must be followed precisely, unapproved deviations in any part of the protocol may result in research permissions being revoked or more serious penalties. Yet another reason, reinforcing why the different topics covered in this lab are so important to adequately address before you start a study. 3. Independence Overview: Most statistical analyses assume that replicates are independent of one another. In other words, the observations and/or measurements made for one replicate (experimental unit) do not have an influence on those made on another. Knowing whether replicates are independent is sometimes straightforward, but sometimes subjective or otherwise challenging. Lack of independence can stem from spatial, temporal, or biological links between replicates. Knowledge of the biology of the study system is often critical in assessing how an experiment can be designed to ensure independence. Now would be a good time to review the examples of spatial, temporal, and biological links that we discussed in the first experimental methods lecture. Some further general examples of lack of independence are: . When you take multiple measurements of the same experimental unit over time o E.g. Measurements of health/growth of animals or plants When you measure experimental units in close proximity (close enough to be experiencing same environmental conditions / microhabitat) o E.g. Plants in the same 1 m plot When you measure individuals that are genetically related E.g. Sibling honey bees in a bee hive o E.g. Siblings living in the same household . When measuring one experimental unit immediately alters the measurements you obtain in another nearby experimental unit o E.g. When taking multiple measurements along a stream (samples linked by current) o E.g. When collecting a sweep-net sample of insects, other insects will fly away, altering your next sample if it is completed in close proximity to the first When designing an experiment, ask yourself "If I had to write a convincing argument in a report or research paper for why these replicates are independent what would I say?" If you cannot provide a simple, reasonable justification, then you will likely have to go back to the drawing board. 2 Some advanced statistical analyses are able to address certain types of lack of independence (e.g. multiple measurements of experimental unit over time), but they are beyond the scope of this course. In this course, the strategy you will use to address lack of independence of observations is to treat non-independent samples as subsample and is covered in the next section.6. Precision and accuracy Overview: While difficult to fully discuss this topic without narrowing down that discussion to a particular area of study, it is important that experiments are designed in such a way that measurements can be made in a precise and accurate way to ensure no bias is unintentionally introduced. Inaccurate and/or imprecise measurement can result in false or misleading conclusions. Recall the diagram we discussed in lecture: Low Accuracy Low aCOUNTY Low precision O High prochion High accuracy O Low precision O High accuracy High precision There are many potential sources of measurement error, some of them easily avoidable like human error and uncalibrated equipment, and some more difficult like subjectivity, implicit biases, and inter-personal variation if there are multiple observers. Careful consideration of how measurements will be made, and strategies that can be employed to ensure those measurements remain consistent and unbiased for the duration of the study must be made prior to beginning any study. Changing how you measure experimental units after an experiment is underway is rarely a viable option.8. Realism and repeatability Overview: We have covered a lot of different topics in this lab, but it is important to not lose sight of the bigger picture when designing experiments and surveys: they should be realistic, they should enable us to effectively answer our research questions, and they should be repeatable. Self-reflection and common sense are a must for any researcher and must be exercised during the design phase of any study. . A study that uses unrealistic treatments, treatment rates, or asks unrealistic questions is of use to nobody. A study that is so large it becomes economically or operationally infeasible is a waste of time and money. . A study that is confounded and fails at answering research questions is also a waste of time and money. . A study that is not repeatable or produces results that are not reproducible is only further contributing to the reproduciblety crisis that is plaguing many scientific fields. 62. Replication Overview: Multiple measurements of independent replicates must be made to allow us to estimate natural variation and produce a representative sample. Without sufficient replication, we lose the ability to determine if a sample was drawn from a focal population, or if two samples are similar or different, which is a fundamental goal of most experiments. More replication is better than less (within reason), but more replication requires more time, money, and other resources, and is thus generally limited by operational constraints. Furthermore, one must ensure replication must occur at the experimental unit level, not the observational unit level (See sections 3 and 4). The number of realistically achievable replicates is going to be vastly different among studies and fields of study. Some general guidelines to follow are as follows: Remember, more is better, so strive for realistic, but maximized numbers of independent replicates. You should always plan for equal replication of each treatment level. Rule of 10: 10 independent replicates for each treatment level of an independent variable is a good starting point. A bare minimum of 4 independent replicates per treatment level is recommended, but this may be insufficient for some experiments and surveys. 2 or 3 independent replicates per treatment level is insufficient is most cases.4. Suhsamples and the risk of committing pseudoreplication Overview: For many experiments it is useful and even preferrable to make multiple observations per expetimeuta] unit. An experimental unit is dened as the scale which the independent application of the same treatment occurs. For examme, if you had lID randomly selected 1 m2 plots in a eld, it would make very little sense to determine seed number in that plot based on measuring a single plant. You would want to measure the number of seeds in say 10 or even 5i] plants per 1 in1 plot. Each plant you measure within the plot is an observational unit, not an exPeriinental unit however, since those measurements are not spatially independent. A similar situation might occur if you made multiple measurements on a human or animal subject over time, with each measurement being a non-independent subsample, and the individual being the experimental unit. One form of pseudoreplication occurs iisuhsamples [observational units] are treated as true replicates {experimental units} for analysis since suhsamples are not independent. Committing this form of pseudoreplication is still a common occurrence in life and social science disciplines and is a serious issue since it renders the analysis invalid and potentially misleading. If your data contains subsamples, you must 'aggregate' your data so that there is one measurement per exPeriinental unit. This is typically done by calculating the mean {average} of the set of subsamples, but there may occasionally be situations where you calculate the sum or median instead. This operation is simple to perform in Excel and R and is covered in the videos. Some advanced analyses allow one to include suhsarnples, but those analyses are beyond the scope of this course. so Watch the Aggregation in Excel video It Download \"Lab 2 aggregation demo Excel.xLxs\" to follow along with this video so- Watch the Aggregation in R video It Download \"Lab 2 aggregation demo R.txt" to follow along with this video
