I need to solve this as soon as possible with explanation.
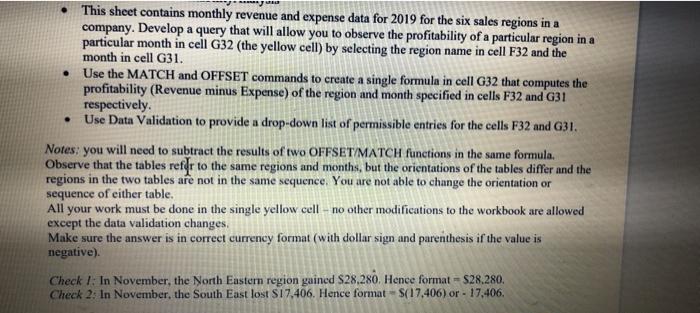
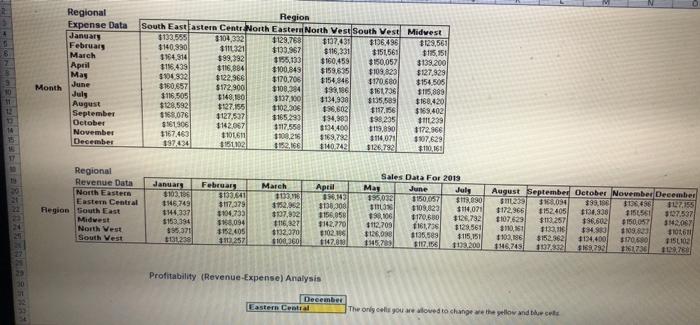
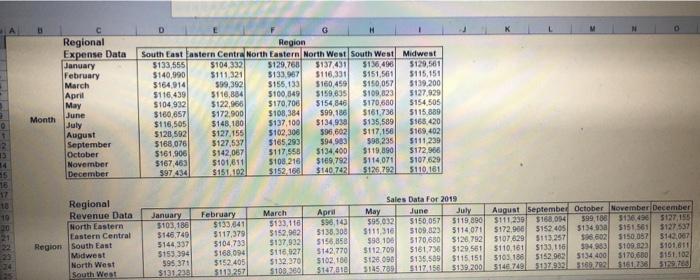
This sheet contains monthly revenue and expense data for 2019 for the six sales regions in a company. Develop a query that will allow you to observe the profitability of a particular region in a particular month in cell G32 (the yellow cell) by selecting the region name in cell F32 and the month in cell G31. Use the MATCH and OFFSET commands to create a single formula in cell G32 that computes the profitability (Revenue minus Expense) of the region and month specified in cells F32 and G31 respectively. Use Data Validation to provide a drop-down list of permissible entries for the cells F32 and G31. Notes: you will need to subtract the results of two OFFSET/MATCH functions in the same formula Observe that the tables reflr to the same regions and months, but the orientations of the tables differ and the regions in the two tables are not in the same sequence. You are not able to change the orientation or sequence of either table. All your work must be done in the single yellow cell - no other modifications to the workbook are allowed except the data validation changes. Make sure the answer is in correct currency format (with dollar sign and parenthesis if the value is negative) Check 1: In November, the North Eastern region gained S28.280. Hence format - S28.280. Check 2: In November, the South East lost $17.406. Hence format - $(17,406) or -17.406. Regional Expense Data January February March April May Month June July August September October November December Region South East Eastern Centr North Easter North Vest South Vest Midvest $133,585 $104,332 $129,758 $137,431 $196,496 $129,560 $140,390 311321 $133.967 $116,331 $164,314 $151,561 $15.951 $99,392 1955,133 $160,459 $150,057 $139.200 $196,439 $116,884 $100,849 $159,615 $109,023 5804832 $127.929 $122.966 $170,708 $154,846 $170.680 $154,505 $160,657 $172.900 $100,004 98,186 $161736 $116.505 $115,889 $140.180 $137.100 $134.938 $135,689 $168.420 $128,592 127.155 $102,006 196,602 $117.156 $168.4021 $168.076 $127.537 $165,283 194.883 $98.235 $161306 3114239 $142.067 $117.558 $134.400 $119,890 1172.966 $167.463 10161 3100,216 $169,782 $116,071 3507.629 397434 3151102 $140.249 $126782 5.180.161 Regional Revenue Data North Eastern Eastern Central Region South East April January $103,104 146749 1444337 1153 394 $95371 131238 February $133.641 $177,379 104.733 $168.094 3152.405 1112257 March $133.16 $152,952 307,872 16,827 $132.070 $100.360 Sales Data For 2019 May June July 395,032 1150057 $113,090 111336 $109,823 3114.071 98,00 8170680 $126,792 $112.709 161,736 $129.561 $126,038 $136.589 $115,151 1445289 SIGIES 11.200 $130,300 1156,058 142.770 $102.5 147.000 August September October November December 5111223 $168094 $9316 3706488 12.155 $172,966 1152.405 134.930 1155 3107.537 1107.629 $113,267 96,602 $150,052 110,161 113,16 $8.98 109.80 10611 103,186 $152.362 124,400 $170,59 15102 46,745 SI 293 1161206 112 North West South West Profitability (Revenue-Expense) Analysis December Eastern Central The only cells you are loved to change the yellow and the cele Regional Expense Data January February March April May June Month July August September October November December Region South East Eastern Centre North Eastern North West South West Midwest $133,555 $104 332 $129.768 3137431 513,496 $129,561 $140,990 $111.321 $133.967 $116,331 5151,561 5115,151 5164914 599,392 $155,133 5160,459 $150,057 5139.200 $116.439 5116,884 5100.549 $159,635 $109,123 5127.920 5104 932 5122,966 5170,700 3154,846 5170,680 $154,505 $160,657 $172.900 $108,384 $99.186 $161.730 5115,889 $116,505 $148. 180 $137,100 $134,930 $135,589 $168.420 5128,592 $127.155 $102,300 596,602 $117.156 5169 402 5168,076 5127,537 $165.299 $94.900 598 235 5111,239 5161,906 $142,087 3117558 5134,400 $119,90 $172,966 $167,463 5101,511 $108.216 $169,792 5114,071 5107.620 597434 $151102 $152.100 $140.742 51217921 5110161 18 17 10 Regional Revenue Data North Eastern Eastern Central Region South East Midwest North West South West January 3103, 186 $146.749 5144337 3153 394 595 371 $121239 February $133,541 3117,379 5104733 $168.094 $152.405 5111257 March $133.110 5152.982 5137 932 $116.927 $132.370 S109.260 April $96,143 5130,300 5156,850 5142,770 $102.100 5147 Sales Data For 2019 May June July 595,032 $150,057 $119,890 5111,510 5109,823 5114071 598 100 5170680 $120.792 $112.709 $161,730 $129,551 5128.090 5135,589 $115.151 3145.709 5117158 5199 200 August September October November December 5111,230 $160.094 399188 3136490 5127, 155 5172.900 5152.405 513493 5151561 3127 537 5107 6205113.257 136.602 3150057 $143.007 5110.161 $133.116 $94.983 $109.923 5101811 5103.1861 5152 9625134 400 $170.600 5151,102 5146.74915177933 5180.792 $161235 5129 Regional Revenue Data North Eastern Eastern Central South East Midwest North West South West January 5103,186 $146,749 $144,337 5153,394 595,371 $131 238 February $133,641 $117,379 $104.733 $168,094 $152.405 $113,257 March $133,116 $152,962 $137.932 $116,927 $132,370 $108 360 April 596,143 $138,308 $156 858 5142,770 $102,186 $147,8181 Sales Data For 2019 May June July $95,032 $150.057 $119,890 $111,316 $109,823 $114,071 $98, 106 $170,680 $126,792 $112,709 $161,736 $129,561 $126,098 $135,589 $115, 151 $145 789 5117156 $139 200 August September October Novembe $111,239 $168,094 $99,186 $136.49 $172,966 $152,405 $134,938 $151,56 $107,629 $113,257 596,602 $150,05 $110,161 $133,116 $94.983 $109,82 $103,186 $152,962 $134,400 $170,680 $146749 $137932 $169,792 $161.73 Profitability (Revenue Expense) Analysis December Eastern Central The only cells you are allowed to change are the yellow and blue cells