Answered step by step
Verified Expert Solution
Link Copied!

Question

1 Approved Answer

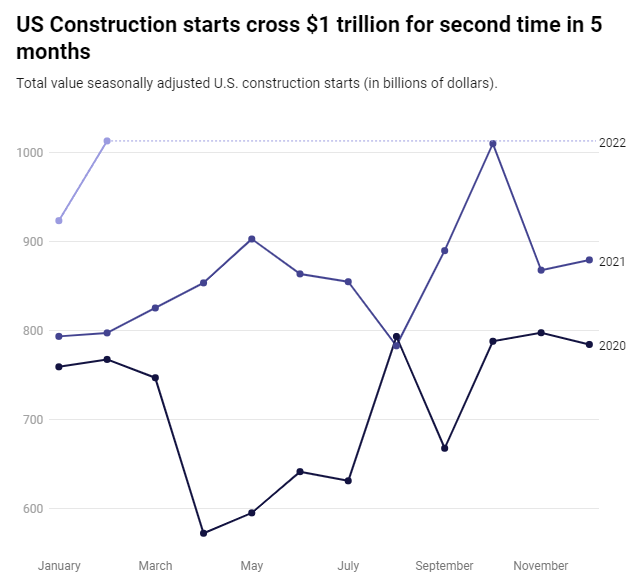
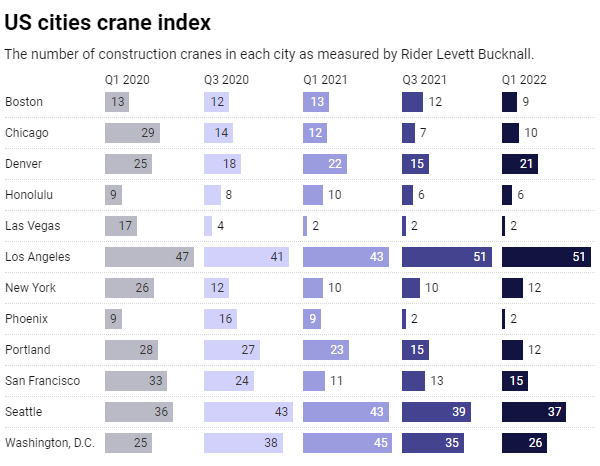
I need to write a small paragraph to describe each following figure. Each figure has a corresponding link which leads you to a webpage where

I need to write a small paragraph to describe each following figure. Each figure has a corresponding link which leads you to a webpage where you can access each data point, when the link is opened, you can see the specific data by hovering your mouse over the plot. In Week 6 Reading materials, there are several links provided to show you how to describe a figure and table if you need any references. Please add the description underneath each figure, and you can insert a new page if more spaces are needed. Your final submission will be this WORD file after your fill out your answer.

  1. Construction Jobs

The labor shortage has consistently been a major challenge for construction companies. Each month, the Bureau of Labor Statistics releases job gains or losses in the industry and divides the figures into residential and nonresidential sectors.
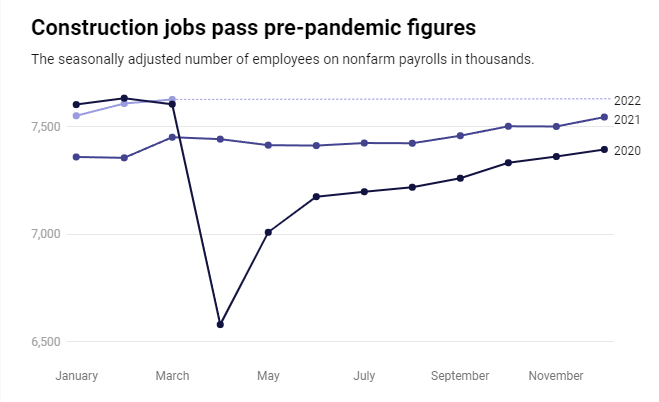
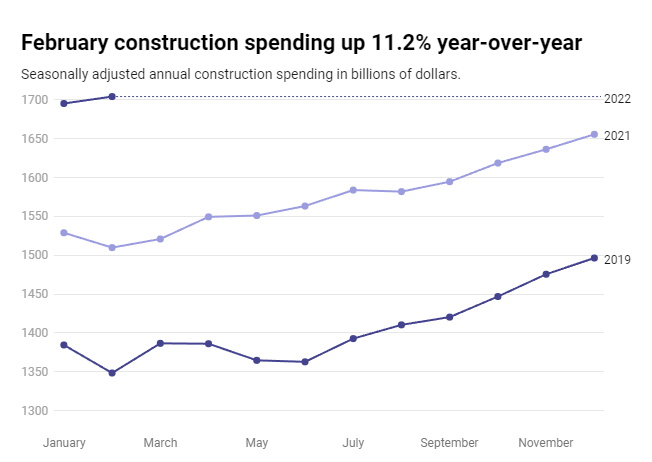
image text in transcribedimage text in transcribedimage text in transcribedimage text in transcribed
Construction jobs pass pre-pandemic figures The seasonally adjusted number of employees on nonfarm payrolls in thousands. 2022 2021 7,500 2020 7,000 6,500 January March May July September NovemberFebruary construction spending up 11.2% year-over-year Seasonally adjusted annual construction spending in billions of dollars. 1700 --: 2022 1650 2021 1600 1550 1500 2019 1450 1400 1350 1300 January March May July September NovemberUS Construction starts cross $1 trillion for second time in 5 months Total value seasonally adjusted U.S. construction starts (in billions of dollars). ": 2022 1000 900 2021 800 2020 700 600 January March May July September NovemberUS cities crane index The number of construction cranes in each city as measured by Rider Levett Bucknall. Q1 2020 Q3 2020 Q1 2021 Q3 2021 Q1 2022 Boston 13 12 13 12 9 Chicago 29 14 12 7 10 Denver 25 18 22 15 21 Honolulu 10 Las Vegas 17 4 Los Angeles 47 41 43 51 51 New York 26 12 10 10 12 Phoenix 16 9 2 12 Portland 28 27 23 15 12 San Francisco 33 24 11 13 15 Seattle 36 43 13 39 37 Washington, D.C. 25 38 45 35 26

Step by Step Solution

There are 3 Steps involved in it

Step: 1

blur-text-image

Get Instant Access to Expert-Tailored Solutions

See step-by-step solutions with expert insights and AI powered tools for academic success

Step: 2

blur-text-image_2

Step: 3

blur-text-image_3

Ace Your Homework with AI

Get the answers you need in no time with our AI-driven, step-by-step assistance

Get Started

Recommended Textbook for

Management Process

Authors: Lee Long

4th Edition

978-0201822939,0201822938

More Books

Students also viewed these General Management questions

Question

don't copy and paste if I will give you 5 0 dislike

Answered: 1 week ago

Question

An ICER value indicates which of two treatment options is better.

Answered: 1 week ago