Answered step by step
Verified Expert Solution
Link Copied!

Question

1 Approved Answer

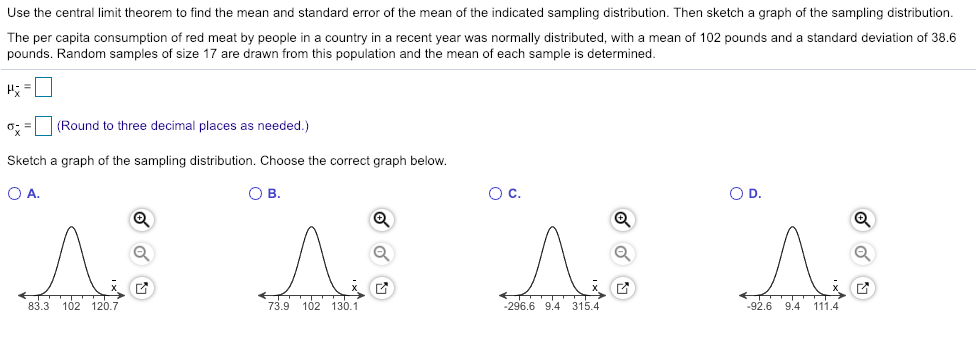
I need urgent help, please help me. Thank you I will be grateful Use the oentral limit theorem to find the mean and standard

"I need urgent help, please help me. Thank you " I will be grateful

image text in transcribedimage text in transcribed
Use the oentral limit theorem to find the mean and standard error of the mean of the indicated sampling distribution. Then sketch a graph of the wmpling distribution. The per capita consumption of red meat by people in a country in a recent year was normally distributed. with a mean of 102 pounds and a standard deviation of 38.5 pounds. Random samples of size 1? are drawn from this population and the mean of each sample is determined. WK 61? = I: {Round to three decimal plaoes as needed.) Sketch a graph of the sampling distribution. Choose the correct graph below. 0A. 03. QC. on. a. a. a. a. Q '51 Q Q i |'_,F i |'_r,' :1 l: i |'_r,' B3_3 102 12D} ?3_B 102 130.1 -296.6 9.4 315.4 43-25 9.4 111.4 Use the standard normal table to find the z - score that corre I corresponds to the given percentile It the area is not in the table use the entry closest to the area If the area is halfway between two entries use the z - score halfway between the corresponding z - scores . If convenient , use technology to find the z - score P 78 Click to view page I of the table . Click to view page 2 of the table The z - score re that corresponds to P 78 is Round to two decimal places as needed . )

Step by Step Solution

There are 3 Steps involved in it

Step: 1

blur-text-image

Get Instant Access to Expert-Tailored Solutions

See step-by-step solutions with expert insights and AI powered tools for academic success

Step: 2

blur-text-image

Step: 3

blur-text-image

Ace Your Homework with AI

Get the answers you need in no time with our AI-driven, step-by-step assistance

Get Started

Students also viewed these Mathematics questions