Investigate Walmarts variable versus fixed inputs and the costs of these inputs. Determine the most recent annual cost of their payroll and labor commitments.
Explore Walmart's Fixed Asset ownership. Discuss the companys asset holdings such as the value of their properties, machinery, and binding leases. Focus on their physical assets. Again, place the physical assets number in context of the size of Walmart's operation.
Does it appear that Walmarts production process is labor or capital intensive?
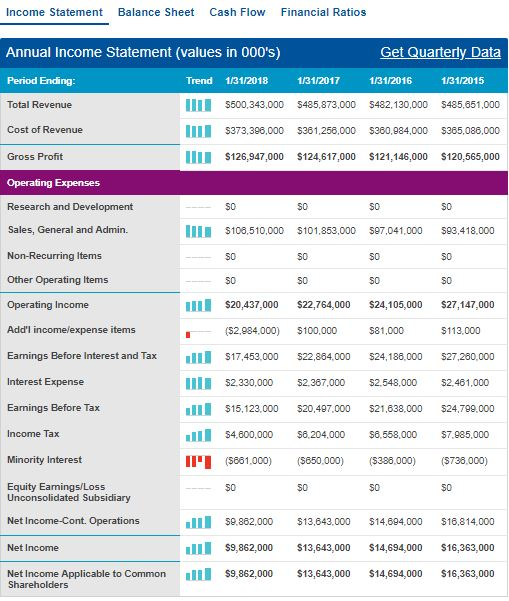
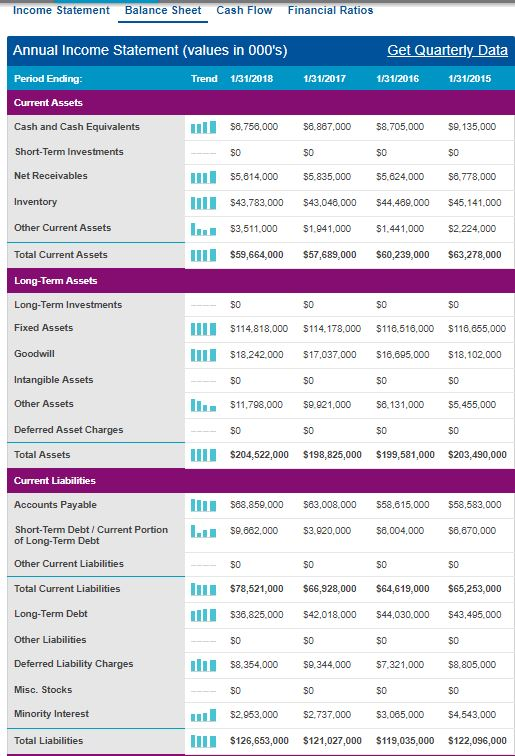
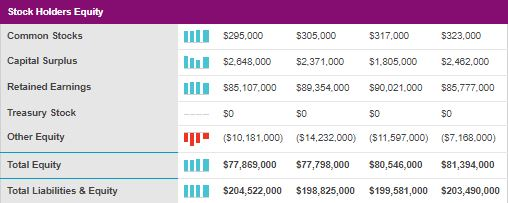
Income Statement Balance Sheet Cash Flow Financial Ratios Annual Income Statement (values in 000's) Period Ending: Total Revenue Get Quarterly Data Trend 1/31/2018 131/2017 131/2016 1/31/2015 $500300 485.873,000 $482,130,000 $485,851,000 II$373,396,000 261,256,000 $360,984.000 $365,086,000 IIII $126,947,000 $124,617,000 $121,146,000 $120,565,000 Cost of Revenue Gross Profit Operating Expenses Research and Development Sales, General and Admin. Non-Recurring Items Other Operating Items Operating Income Add'l income/expense items Earnings Before Interest and Tax Interest Expense Earnings Before Tax Income Tax Minority Interest Equity Eamings/Loss 50 50 50 50 II $108,510.000 101,853,000 97,041000 53,418,000 50 50 50 50 50 50 50 50 $20,437,000 s22,764,000 s24,105.000 s27,147.000 (52,984,000) 100,000 81,000 $113,000 IIIS17453.000 S22,884.000 S24, 188.000 S27,280,000 IIII S2.330,000 2.367.000 2.548.000 $2.481,000 $15,123.000 $20,497.000 $21,638,000 $24,799.000 54,600,000 6,204.000 $8,558,000 $7,95,000 II (5881,000) (5650.000) (5388.000) ($738.000) 50 50 50 50 Unconsolidated Subsidiary $9.82.000 13,843.000 $14894.000 $16,814000 $9,862,000 13,643,000 $14,694,000 $16,363,000 Net Income Applicable to Common9,862,000 $13,643,000 $14,694,000 16,363,000 Net Income-Cont. Operations Net Income Shareholders Income Statement Balance Sheet Cash Flow Financial Ratios Get Quarterly Data Annual Income Statement (values in 000's) Period Ending Current Assets Trend 1/31/2018 1/31/2017 1/31/2016 1/31/2015 II $8,75,000 867000 $8,705,000 .135,000 Cash and Cash Equivalents Short-Term Investments Net Receivables Inventory Other Current Assets Total Current Assets Long-Term Assets Long-Term Investments Fixed Assets Goodwill Intangible Assets Other Assets Deferred Asset Charges Total Assets Current Liabilities Accounts Payable Short-Term Debt/ Current Portion0.662.000 50 50 S0 III $5814.000 6.835,000 $5,624,000 $8,778000 II$43,783000 43,048000 $44,489.000 $45,141.000 $3,5000 1.941,000 $1.441,000 2224,000 III $59,664,000 57,689,000 $60,239,000 S63,278,000 50 $114.818,000 5114.178,000 118.518,000 $116.855,000 II $18,242000 17,037.000 16,695,000 18,102.000 50 $11,798,000 9.921,000 6.131,000 5,455,000 50 50 I $204,522,000 $198,825,000 $199,581,000 S203,490,000 se8,859.000 se3,008,000 s53.6 15,000 558,583,000 $3.20,000 004,000 $8,670.000 of Long-Term Debt Other Current Liabilities 50 III $78,521,000 $,928,000 64,619,000 $65,253,000 I $36,825.000 542.018,000 44.030.000 43495,000 Total Current Liabilities Long-Term Debt Other Liabilities Deferred Liability Charges Misc. Stocks Minority Interest Total Liabilities 50 S0 S0 s8.354,000 s9.344,000 $7,321,000 s8.805.000 50 50 50 $2.953,000 $2,737.000 $3,085,000 $4543,000 IIII $126,653,000 $121,027,000 $119,035,000 $122,096,000 Stock Holders Equity Common Stocks Capital Surplus Retained Earnings Treasury Stock Other Equity Total Equity Total Liabilities & Equity $295,000 5305,000 17.000 23,000 I$2648000 2.371.000 $1.805,000 2,482,000 III $85,07000 $89,354.000 $0,021.000 $85,777.000 50 50 50 50 (S 10.181,000) (S14,232.000) (S 1 1.597,000) (57.168.000) III $77,869,000 77,798,000 S80,546,000 $81,394,000 I$204,522,000 $198,825,000 $199,581,000 $203,490,000 Income Statement Balance Sheet Cash Flow Financial Ratios Annual Income Statement (values in 000's) Period Ending: Total Revenue Get Quarterly Data Trend 1/31/2018 131/2017 131/2016 1/31/2015 $500300 485.873,000 $482,130,000 $485,851,000 II$373,396,000 261,256,000 $360,984.000 $365,086,000 IIII $126,947,000 $124,617,000 $121,146,000 $120,565,000 Cost of Revenue Gross Profit Operating Expenses Research and Development Sales, General and Admin. Non-Recurring Items Other Operating Items Operating Income Add'l income/expense items Earnings Before Interest and Tax Interest Expense Earnings Before Tax Income Tax Minority Interest Equity Eamings/Loss 50 50 50 50 II $108,510.000 101,853,000 97,041000 53,418,000 50 50 50 50 50 50 50 50 $20,437,000 s22,764,000 s24,105.000 s27,147.000 (52,984,000) 100,000 81,000 $113,000 IIIS17453.000 S22,884.000 S24, 188.000 S27,280,000 IIII S2.330,000 2.367.000 2.548.000 $2.481,000 $15,123.000 $20,497.000 $21,638,000 $24,799.000 54,600,000 6,204.000 $8,558,000 $7,95,000 II (5881,000) (5650.000) (5388.000) ($738.000) 50 50 50 50 Unconsolidated Subsidiary $9.82.000 13,843.000 $14894.000 $16,814000 $9,862,000 13,643,000 $14,694,000 $16,363,000 Net Income Applicable to Common9,862,000 $13,643,000 $14,694,000 16,363,000 Net Income-Cont. Operations Net Income Shareholders Income Statement Balance Sheet Cash Flow Financial Ratios Get Quarterly Data Annual Income Statement (values in 000's) Period Ending Current Assets Trend 1/31/2018 1/31/2017 1/31/2016 1/31/2015 II $8,75,000 867000 $8,705,000 .135,000 Cash and Cash Equivalents Short-Term Investments Net Receivables Inventory Other Current Assets Total Current Assets Long-Term Assets Long-Term Investments Fixed Assets Goodwill Intangible Assets Other Assets Deferred Asset Charges Total Assets Current Liabilities Accounts Payable Short-Term Debt/ Current Portion0.662.000 50 50 S0 III $5814.000 6.835,000 $5,624,000 $8,778000 II$43,783000 43,048000 $44,489.000 $45,141.000 $3,5000 1.941,000 $1.441,000 2224,000 III $59,664,000 57,689,000 $60,239,000 S63,278,000 50 $114.818,000 5114.178,000 118.518,000 $116.855,000 II $18,242000 17,037.000 16,695,000 18,102.000 50 $11,798,000 9.921,000 6.131,000 5,455,000 50 50 I $204,522,000 $198,825,000 $199,581,000 S203,490,000 se8,859.000 se3,008,000 s53.6 15,000 558,583,000 $3.20,000 004,000 $8,670.000 of Long-Term Debt Other Current Liabilities 50 III $78,521,000 $,928,000 64,619,000 $65,253,000 I $36,825.000 542.018,000 44.030.000 43495,000 Total Current Liabilities Long-Term Debt Other Liabilities Deferred Liability Charges Misc. Stocks Minority Interest Total Liabilities 50 S0 S0 s8.354,000 s9.344,000 $7,321,000 s8.805.000 50 50 50 $2.953,000 $2,737.000 $3,085,000 $4543,000 IIII $126,653,000 $121,027,000 $119,035,000 $122,096,000 Stock Holders Equity Common Stocks Capital Surplus Retained Earnings Treasury Stock Other Equity Total Equity Total Liabilities & Equity $295,000 5305,000 17.000 23,000 I$2648000 2.371.000 $1.805,000 2,482,000 III $85,07000 $89,354.000 $0,021.000 $85,777.000 50 50 50 50 (S 10.181,000) (S14,232.000) (S 1 1.597,000) (57.168.000) III $77,869,000 77,798,000 S80,546,000 $81,394,000 I$204,522,000 $198,825,000 $199,581,000 $203,490,000