

Question: I only need help with part B 12. Time-Series Graph: Google's Ngram Viewer Interesting time-series graphs can be generated using Google's Ngram Viewer (http:/grams.googlelabs.com This
I only need help with part B
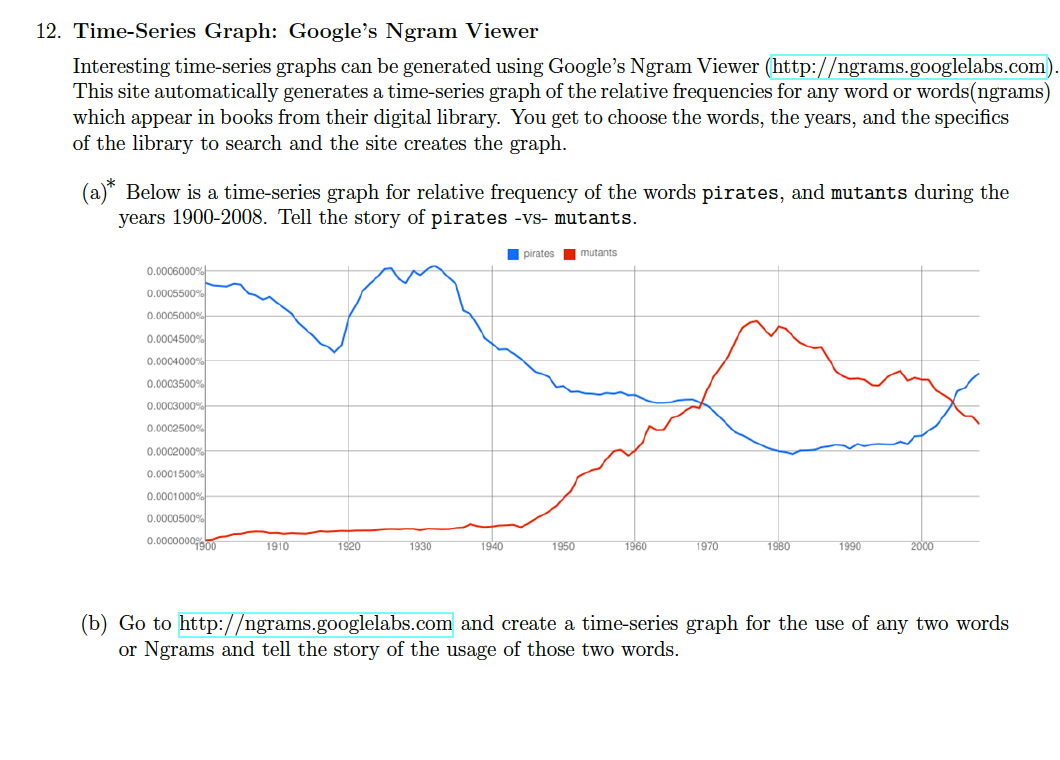
12. Time-Series Graph: Google's Ngram Viewer Interesting time-series graphs can be generated using Google's Ngram Viewer (http:/grams.googlelabs.com This site automatically generates a time-series graph of the relative frequencies for any word or words(ngrams) which appear in books from their digital library. You get to choose the words, the years, and the specifics of the library to search and the site creates the graph. (a)" Below is a time-series graph for relative frequency of the words pirates, and mutants during the years 1900-2008. Tell the story of pirates -vs- mutants. pirates mutants 0.0006000% 0.0005500% 0.0005000% 0.0004500% 0.0004000%% 0.0003500% 0.0003000% 0.0002500% 0.0002000% 0.0001500% 0.0001000% 0.0000500% 0.00000905950 1910 1920 1930 1940 1950 1960 1970 1980 1990 2000 (b) Go to http:/grams.googlelabs.com and create a time-series graph for the use of any two words or Ngrams and tell the story of the usage of those two words
Step by Step Solution
There are 3 Steps involved in it

Get step-by-step solutions from verified subject matter experts