Answered step by step
Verified Expert Solution
Link Copied!

Question

1 Approved Answer

I only need part # 5 how to draw a decision tree? Q3: You are hired as loan officer of Easy Loan Bank and a

I only need part # 5 how to draw a decision tree? image text in transcribed
Q3: You are hired as loan officer of Easy Loan Bank and a company, Engine Co., requested a loan of $1,000,000. Based on the Bank's records, you know that there are three categories for loan applicants; low risk, average risk and high risk, but you don't know which category fits Engine Co. Easy Loan historical data shows that companies in car industry (like Engine Co.) are generally 30 percent in low risk category, 50 percent in average risk category, and 20 percent in high risk category. If the loan is paid, the expected profit of low risk group is +$120,000, for average risk is +$80,000, and for the high risk is -$40,000 You also have an option to ask a credit rating organization to categorize Engine Co. in one of the three buckets A rating(low risk), B rating(average risk), C rating(high risk) with a fee of $10,000. The following table shows the percentages that Credit Company provided about the accuracy of their evaluation in the past. Actual Category of Applicant Average Risk High Risk Low Risk Evaluated 12% 20% A Rating B Rating C Rating 80% 23% 65% 70% 15% results of Credit Check 10% 5% 1. Assuming the credit rating organization in not used, use Bayes's decision rule to determine which decision alternative should be chosen. (Show your calculations) 2. Find EVPI, Expected Payoff with Perfect Information. Does this answer indicate that consideration should be given to using the credit rating organization? Assume now the credit rating organization is used. Develop a probability tree diagram to find 3. the posterior probabilities of the respective state of nature for each of the three possible credit evaluations of this potential customer. (Hint: You need to draw a graph, similar to Figure 16.2 of text book page 692) 4. Calculate the EVE for the cred it rating. (Hint: use posterior probability to calculate the Expected Value of Experimentation) Drawand properly label the decision tree and calculate the payoffs at the end of each branch, then apply the backward induction procedures and identify the resulting optimal policy (Hint: You need to draw a decision tree similar to Figure 16.6 page 699) 5

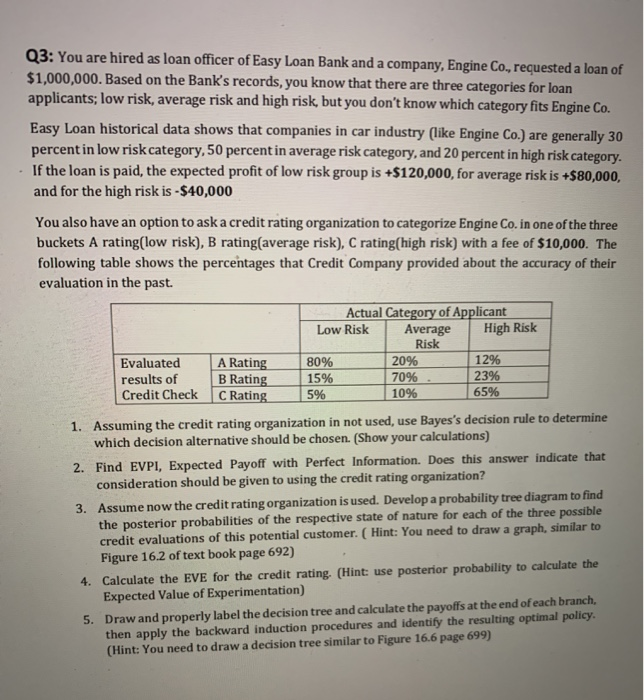
Step by Step Solution

There are 3 Steps involved in it

Step: 1

blur-text-image

Get Instant Access to Expert-Tailored Solutions

See step-by-step solutions with expert insights and AI powered tools for academic success

Step: 2

blur-text-image

Step: 3

blur-text-image

Ace Your Homework with AI

Get the answers you need in no time with our AI-driven, step-by-step assistance

Get Started

Recommended Textbook for

Introduction to Finance Markets Investments and Financial Management

Authors: Melicher Ronald, Norton Edgar

15th edition

9781118800720, 1118492676, 1118800729, 978-1118492673

More Books

Students also viewed these Finance questions