Answered step by step
Verified Expert Solution
Question
1 Approved Answer
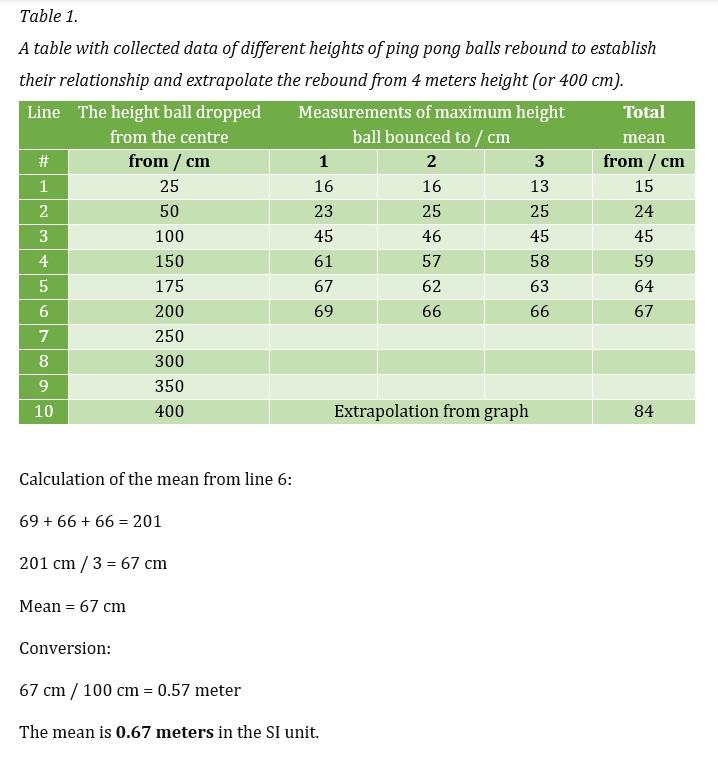
I plot the graph correctly with the title, the two X & Y axes? Table 1. A table with collected data of different heights


I plot the graph correctly with the title, the two X & Y axes? Table 1. A table with collected data of different heights of ping pong balls rebound to establish their relationship and extrapolate the rebound from 4 meters height (or 400 cm). Line The height ball dropped Measurements of maximum height from the centre ball bounced to / cm # 1 2 3 4 5 6 7 8 9 10 Calculation of the mean from line 6: from / cm 25 50 100 150 175 200 250 300 350 400 69 +66 + 66 = 201 201 cm / 3 = 67 cm Mean = 67 cm Conversion: 67 cm / 100 cm = 0.57 meter 1 16 23 45 61 67 69 The mean is 0.67 meters in the SI unit. 2 16 25 46 57 62 66 3 13. 25 45 58 63 66 Extrapolation from graph Total mean from / cm 15 24 45 59 64 67 84
Step by Step Solution
There are 3 Steps involved in it
Step: 1
Calculate the total mech Prom the culla edad Jata 696666 201 ...
Get Instant Access to Expert-Tailored Solutions
See step-by-step solutions with expert insights and AI powered tools for academic success
Step: 2

Step: 3

Ace Your Homework with AI
Get the answers you need in no time with our AI-driven, step-by-step assistance
Get Started


