
I posted question as picture.
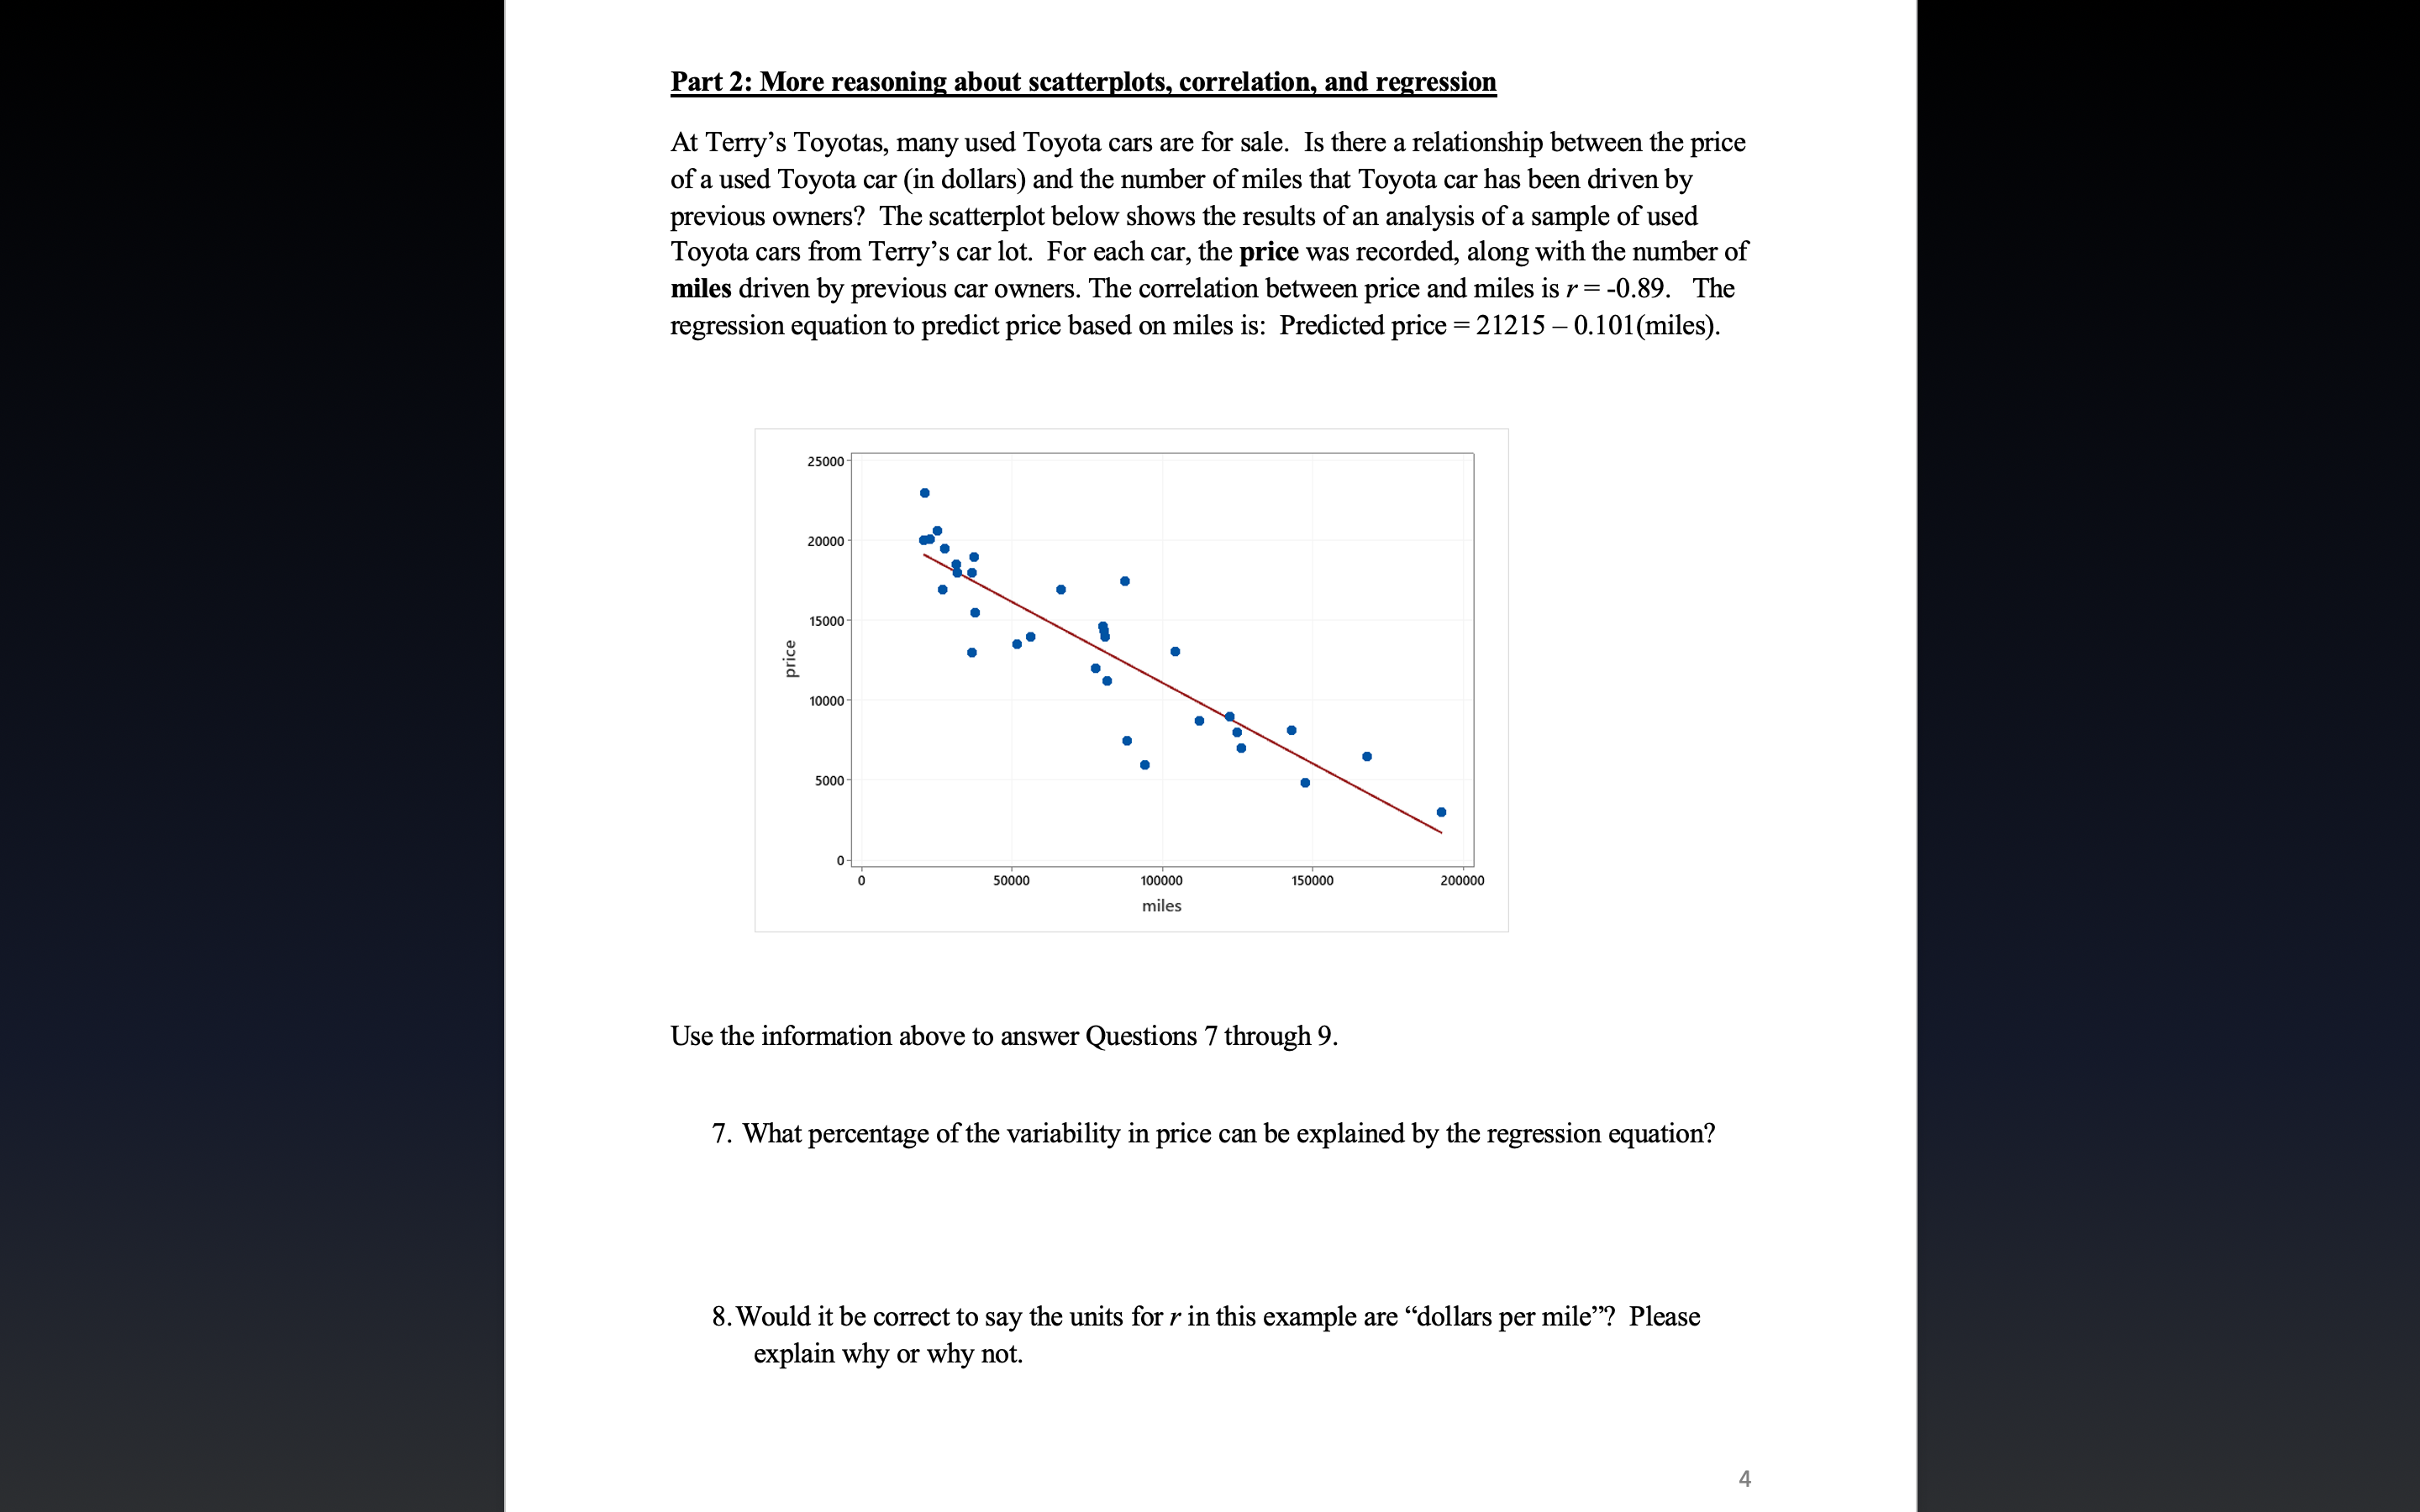
Part 1: Understanding the basics On Twitter, the tweets that individuals post can be liked, and they can also be shared with others (or \"retweeted\"). Do tweets that get more likes end up getting more retweets? To investigate this issue, let's focus on the tweets from one account. The account is called \"The Quote\" (h_ttgs://twitter.com/theguotet. We chose a random sample of tweets from \"The Quote,\" and for each tweet, we looked at the number of likes it received and the number of times it was shared with others (or retweeted). The data we obtained is displayed in the scatterplot below. A correlation coefcient, r, was also computed, and it was observed that r = 0.98. When a regression equation was constructed in order to predict number of retweets based on number of likes, the equation was as follows: Predicted number of retweets = 5.20 + 0.23(number of likes) Number 0' [Gill/EMS I00 o 500 moo 1m am 2500 Number of likes Use the information above to answer Questions 1 through 6. 1.We should consider the relationship between number of likes and number of retweets to have a form that is a direction that is , and a strength that is 2. As the number of likes increases by one, we predict the number of retweets to by 3. A tweet from \"The Quote\" that has 780 likes would be predicted to have how many retweets? 4. Suppose you learn about a tweet from \"The Quote\" that was accidentally le out of the analysis. The tweet had 525 likes and 450 retweets. How would you expect the correlation between number of likes and number of retweets to change if this tweet was added to the analysis? Please explain. 5. Should we use the regression equation to predict the number of retweets for a tweet from \"The Quote\" that has 5000 likes? Please explain why or why not 6. Since the correlation between number of likes and number of retweets is very close to 1, should we conclude that the number of likes a tweet gets causes that tweet to be shared more with others (or retweeted)? Please explain. Part 2: More reasoning about scattemlots, correlatiog and regression At Terry's Toyotas, many used Toyota cars are for sale. Is there a relationship between the price of a used Toyota car (in dollars) and the number of miles that Toyota car has been driven by previous owners? The scatterplot below shows the results of an analysis of a sample of used Toyota cars from Terry's car lot. For each car, the price was recorded, along with the number of miles driven by previous car owners. The correlation between price and miles is r = -0.89. The regression equation to predict price based on miles is: Predicted price = 21215 0'101(miles). 25mm 20000 15000 price 10000 5000 n snow 10mm 15mm zooooo miles Use the information above to answer Questions 7 through 9. 7. What percentage of the variability in price can be explained by the regression equation? 8.Would it be correct to say the units for r in this example are \"dollars per mile\"? Please explain why or why not. 9. Suppose that instead of measuring price in dollars, we decide it would be better to measure price in cents. If we change the units of measurement in this way, how would you expect the correlation (or r) to change? 10. Terry's best friend, Heather, is the owner of Heather's Hondas. Like Terry, Heather sells used cars, and she too would like to try to predict the price of a used car based on the number of miles the car was driven by previous owners. When Heather creates a scatterplot, she notices a linear relationship between these two variables, and she obtains the following regression equation. Predicted price = 18855.05 0.101(miles) Heather also nds that r-squared is equal to 46.9%. This means the correlation (or r) between price and miles for Heather's sample of cars must be equal to what value? Part 3: What went wrong? Read carefully through the following four problems (Questions 11-14). Each problem includes a mistake of some kind, and we would like you to explain what is wrong. 11. Over the years, Dr. Gundlach has observed that student scores on her midterm and nal exams have a strong, positive, and linear relationship. She would therefore like to construct a regression equation in order to predict nal exam score based on midterm exam score. As a rst step, Dr. Gundlach creates a scatterplot, with final exam score on the x-axis (or horizontal axis) and midterm exarn score on the yaxis (or vertical axis). 12. If the correlation between two variables is positive, this means that if we want to predict one variable based on the other, the intercept in the regression equation must also be positive. 13. Upon gathering data 'om a random sample of classmates, Margaret reports the correlation between favorite color and major to be r = 0.63. 14. When asked if the correlation of r = 0.25 is weaker than the correlation of r = 4175, Philip says \"no.\


