 I
I
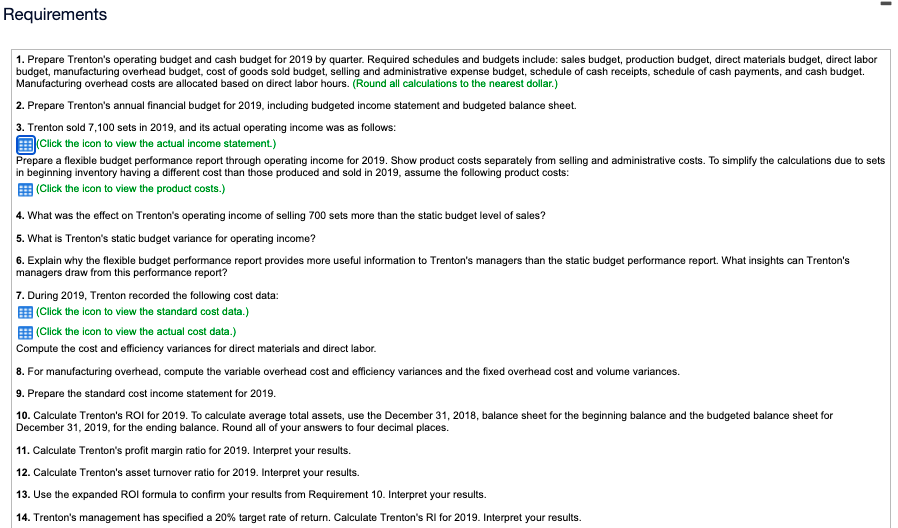
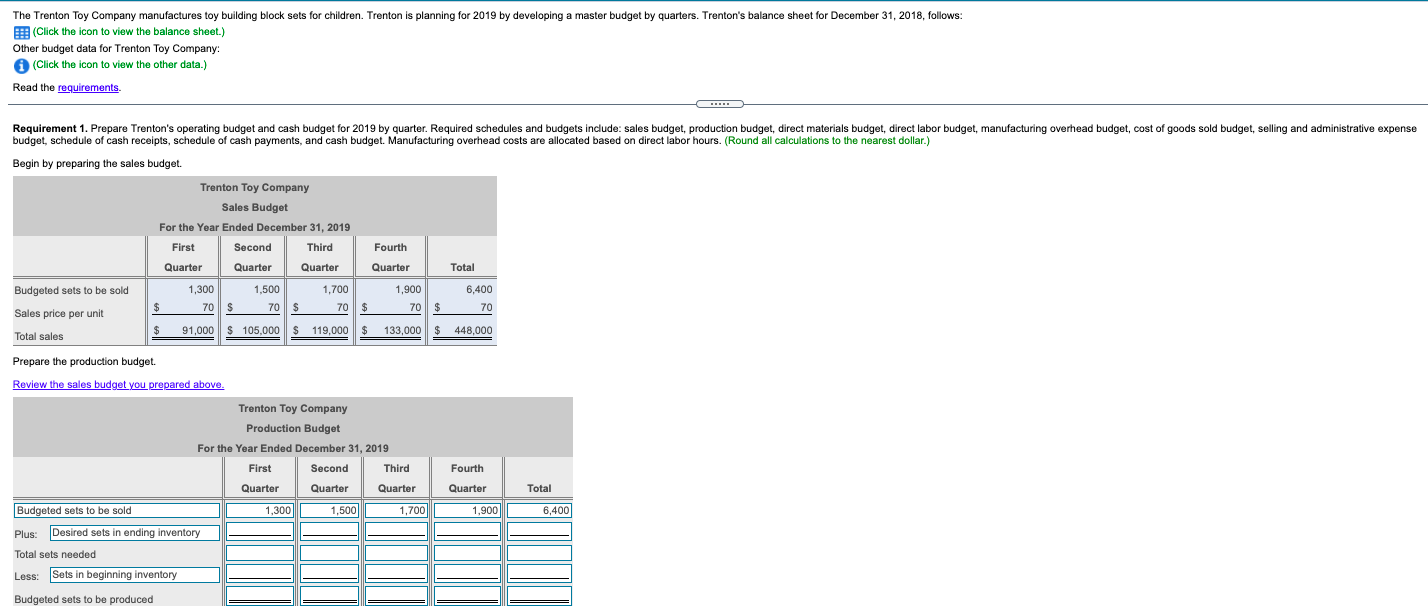
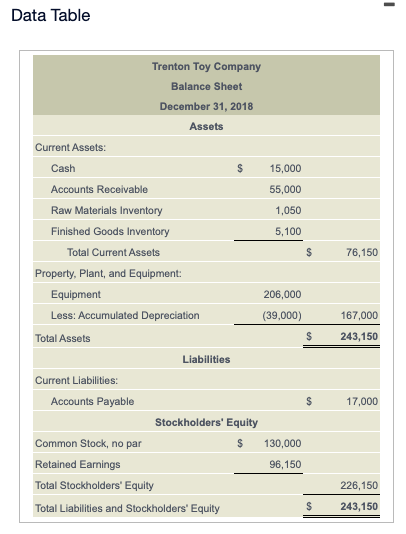
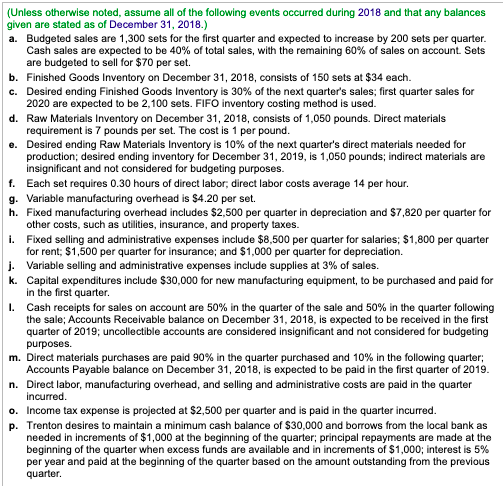
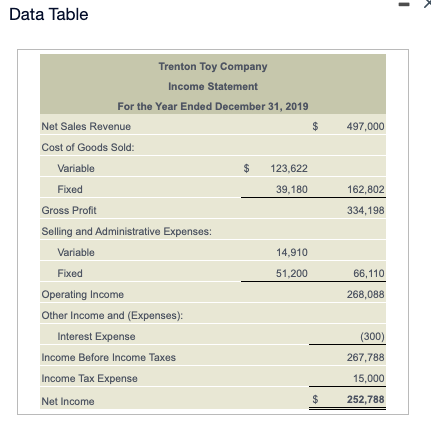
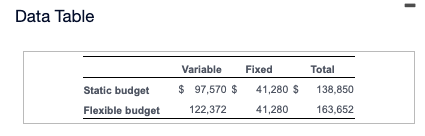
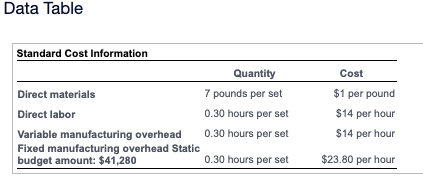
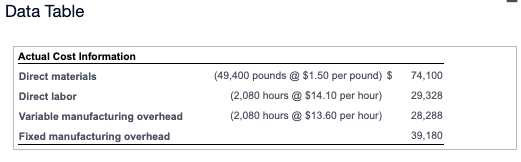
- Requirements 1. Prepare Trenton's operating budget and cash budget for 2019 by quarter. Required schedules and budgets include: sales budget, production budget, direct materials budget, direct labor budget , manufacturing overhead budget, cost of goods sold budget , selling and administrative expense budget, schedule of cash receipts, schedule of cash payments, and cash budget. Manufacturing overhead costs are allocated based on direct labor hours. (Round all calculations to the nearest dollar.) 2. Prepare Trenton's annual financial budget for 2019, including budgeted income statement and budgeted balance sheet. 3. Trenton sold 7,100 sets in 2019, and its actual operating income was as follows: Click the icon to view the actual income statement.) Prepare a flexible budget performance report through operating income for 2019. Show product costs separately from selling and administrative costs. To simplify the calculations due to sets in beginning inventory having a different cost than those produced and sold in 2019, assume the following product costs: (Click the icon to view the product costs.) 4. What was the effect on Trenton's operating income of selling 700 sets more than the static budget level of sales? 5. What is Trenton's static budget variance for operating income? 6. Explain why the flexible budget performance report provides more useful information to Trenton's managers than the static budget performance report. What insights can Trenton's managers draw from this performance report? 7. During 2019, Trenton recorded the following cost data: (Click the icon to view the standard cost data.) Click the icon to view the actual cost data.) Compute the cost and efficiency variances for direct materials and direct labor. 8. For manufacturing overhead, compute the variable overhead cost and efficiency variances and the fixed overhead cost and volume variances. 9. Prepare the standard cost income statement for 2019. 10. Calculate Trenton's ROI for 2019. To calculate average total assets, use the December 31, 2018, balance sheet for the beginning balance and the budgeted balance sheet for December 31, 2019, for the ending balance. Round all of your answers to four decimal places. 11. Calculate Trenton's profit margin ratio for 2019. Interpret your results. 12. Calculate Trenton's asset turnover ratio for 2019. Interpret your results. 13. Use the expanded ROI formula to confirm your results from Requirement 10. Interpret your results. 14. Trenton's management has specified a 20% target rate of return. Calculate Trenton's RI for 2019. Interpret your results. The Trenton Toy Company manufactures toy building block sets for children. Trenton is planning for 2019 by developing a master budget by quarters. Trenton's balance sheet for December 31, 2018, follows: (Click the icon to view the balance sheet.) Other budget data for Trenton Toy Company: (Click the icon to view the other data.) Read the requirements. Requirement 1. Prepare Trenton's operating budget and cash budget for 2019 by quarter. Required schedules and budgets include: sales budget, production budget, direct materials budget, direct labor budget, manufacturing overhead budget, cost of goods sold budget, selling and administrative expense budget, schedule of cash receipts, schedule of cash payments, and cash budget. Manufacturing overhead costs are allocated based on direct labor hours. (Round all calculations to the nearest dollar.) Begin by preparing the sales budget. Trenton Toy Company Sales Budget For the Year Ended December 31, 2019 , First Second Third Fourth Quarter Quarter Quarter Quarter Total Budgeted sets to be sold 1,300 1,500 1,700 1,900 6,400 $ 70 $ 70 $ 70 70 $ Sales price per unit $ 70 $ Total sales 91,000 $ 105,000 $ 119,000 $133,000 $ 448,000 Prepare the production budget. Review the sales budget you prepared above. Trenton Toy Company Production Budget For the Year Ended December 31, 2019 First Second Third Quarter Quarter Quarter Fourth Quarter Total 1,300 1,500 1,700 1,900 6,400 Budgeted sets to be sold Plus: Desired sets in ending inventory Total sets needed Less: Sets in beginning inventory Budgeted sets to be produced - Data Table 76,150 Trenton Toy Company Balance Sheet December 31, 2018 Assets Current Assets: Cash $ 15,000 Accounts Receivable 55,000 Raw Materials Inventory 1,050 Finished Goods Inventory 5,100 Total Current Assets $ Property, Plant, and Equipment: Equipment 206,000 Less: Accumulated Depreciation (39,000) Total Assets $ Liabilities Current Liabilities: Accounts Payable Stockholders' Equity Common Stock, no par $ 130,000 Retained Earnings 96,150 Total Stockholders' Equity Total Liabilities and Stockholders' Equity $ 167,000 243,150 17,000 226,150 243,150 (Unless otherwise noted, assume all of the following events occurred during 2018 and that any balances given are stated as of December 31, 2018.) a. Budgeted sales are 1,300 sets for the first quarter and expected to increase by 200 sets per quarter. Cash sales are expected to be 40% of total sales, with the remaining 60% of sales on account. Sets are budgeted to sell for $70 per set. b. Finished Goods Inventory on December 31, 2018, consists of 150 sets at $34 each. c. Desired ending Finished Goods Inventory is 30% of the next quarter's sales; first quarter sales for 2020 are expected to be 2,100 sets. FIFO inventory costing method is used. d. Raw Materials Inventory on December 31, 2018, consists of 1,050 pounds. Direct materials requirement is 7 pounds per set. The cost is 1 per pound. e. Desired ending Raw Materials Inventory is 10% of the next quarter's direct materials needed for production; desired ending inventory for December 31, 2019, is 1,050 pounds; indirect materials are insignificant and not considered for budgeting purposes. f. Each set requires 0.30 hours of direct labor, direct labor costs average 14 per hour. g. Variable manufacturing overhead is $4.20 per set. h. Fixed manufacturing overhead includes $2,500 per quarter in depreciation and $7,820 per quarter for other costs, such as utilities, insurance, and property taxes. i. Fixed selling and administrative expenses include $8,500 per quarter for salaries; $1,800 per quarter for rent: $1,500 per quarter for insurance; and $1,000 per quarter for depreciation. j. Variable selling and administrative expenses include supplies at 3% of sales. k. Capital expenditures include $30,000 for new manufacturing equipment, to be purchased and paid for in the first quarter. 1. Cash receipts for sales on account are 50% in the quarter of the sale and 50% in the quarter following the sale, Accounts Receivable balance on December 31, 2018, is expected to be received in the first quarter of 2019; uncollectible accounts are considered insignificant and not considered for budgeting purposes. m. Direct materials purchases are paid 90% in the quarter purchased and 10% in the following quarter; Accounts Payable balance on December 31, 2018, is expected to be paid in the first quarter of 2019. n. Direct labor, manufacturing overhead, and selling and administrative costs are paid in the quarter incurred. o. Income tax expense is projected at $2,500 per quarter and is paid in the quarter incurred. p. Trenton desires to maintain a minimum cash balance of $30,000 and borrows from the local bank as needed in increments of $1,000 at the beginning of the quarter; principal repayments are made at beginning of the quarter when excess funds are available and in increments of $1,000; interest is 5% per year and paid at the beginning of the quarter based on the amount outstanding from the previous quarter. Data Table 497,000 162,802 334,198 Trenton Toy Company Income Statement For the Year Ended December 31, 2019 Net Sales Revenue Cost of Goods Sold: Variable $ 123,622 Fixed 39,180 Gross Profit Selling and Administrative Expenses: Variable 14,910 Fixed 51,200 Operating Income Other Income and (Expenses): Interest Expense Income Before Income Taxes Income Tax Expense Net Income 66, 110 268,088 (300) 267,788 15,000 $ 252,788 - Data Table Variable Fixed Total 41,280 $ Static budget Flexible budget $ 97,570 $ 122,372 138,850 163,652 41,280 Data Table Cost Standard Cost Information Quantity Direct materials 7 pounds per set Direct labor 0.30 hours per set Variable manufacturing overhead 0.30 hours per set Fixed manufacturing overhead Static budget amount: $41,280 0.30 hours per set $1 per pound $14 per hour $14 per hour $23.80 per hour Data Table 74,100 Actual Cost Information Direct materials Direct labor Variable manufacturing overhead Fixed manufacturing overhead (49,400 pounds @ $1.50 per pound) $ (2,080 hours @ $14.10 per hour) (2,080 hours @ $13.60 per hour) 29,328 28,288 39,180