I understand it is more than one question , please dont just answer one i need help!!!
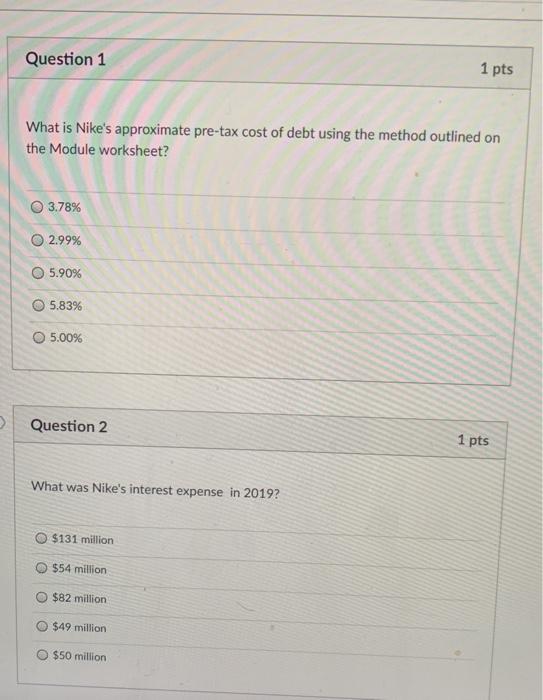
What is Nike's approximate pre-tax cost of debt using the method outlined on the Module worksheet?
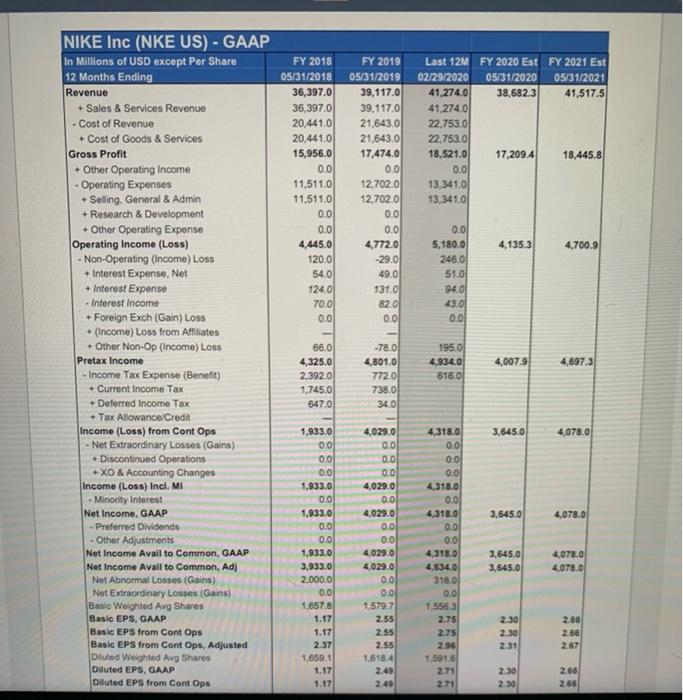
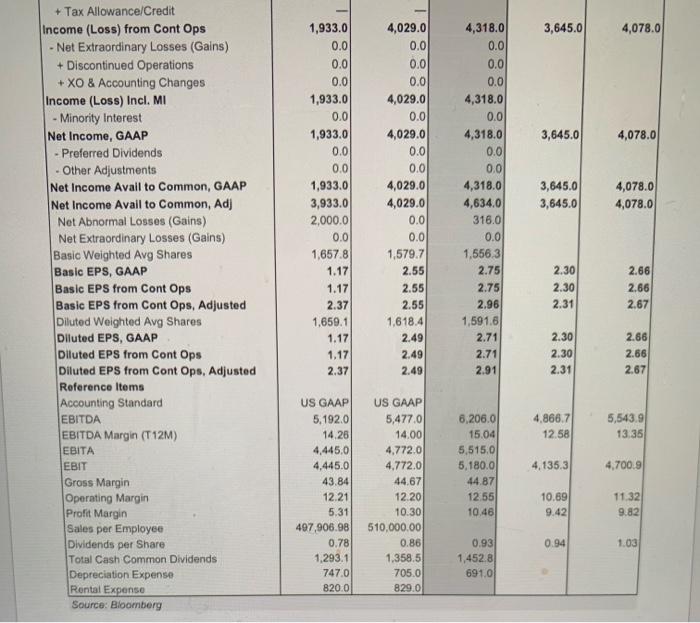
What was Nike's interest expense in 2019?
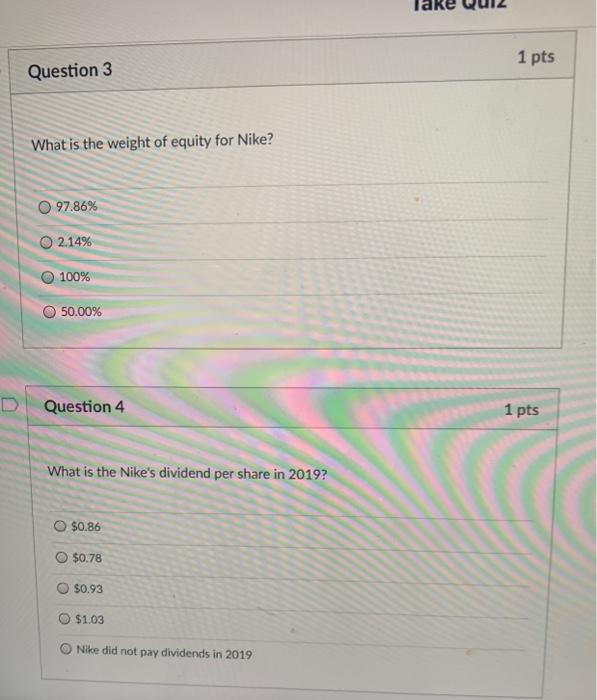
What is the weight of equity for Nike?
What is the Nike's dividend per share in 2019?
What is Nike's approximate cost of equity?
What is your approximate estimate of Nike's WACC based on the worksheet?
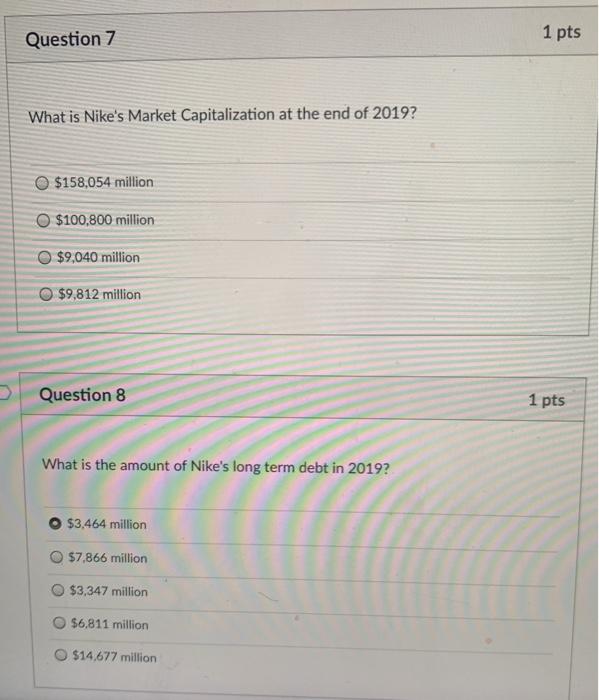
What is Nike's Market Capitalization at the end of 2019?
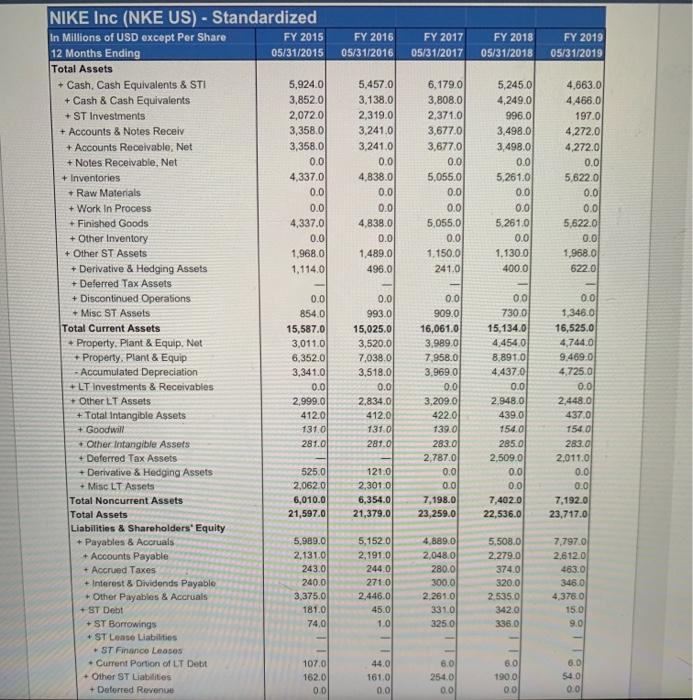
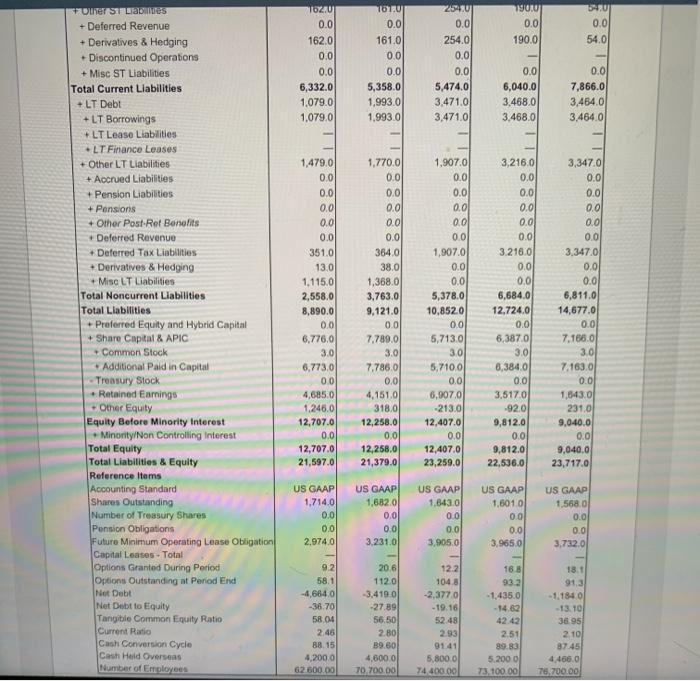
What is the amount of Nike's long term debt in 2019?
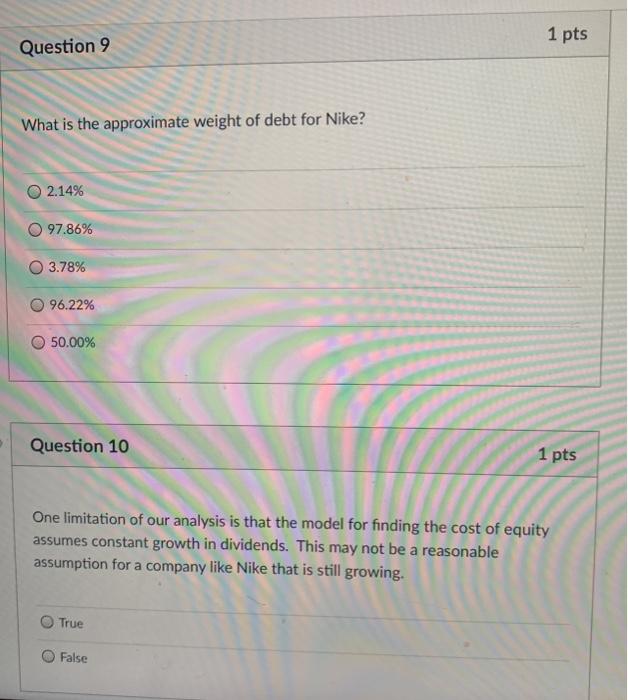
What is the approximate weight of debt for Nike?
One limitation of our analysis is that the model for finding the cost of equity assumes constant growth in dividends. This may not be a reasonable assumption for a company like Nike that is still growing.
FY 2018 05/31/2018 36,397.0 36,397.0 20.441.0 20,441.00 15,956.0 0.0 11,511.0 11,511.0 0.0 0.0 4,445.0 120.0 540 124.0 70.0 0.0 FY 2019 05/31/2019 39,117.0 39,117,0 21,6430 21,643.0 17,474.0 0.0 12.7020 12.702.0 0.0 0.0 4,772.0 -29.0 49.0 131.0 820 Last 12M FY 2020 Est FY 2021 Est 02/29/2020 05/31/2020 05/31/2021 41.274.0 38,682.3 41,517.5 41.274.0 22,7530 22.753.0 18.521.0 17,209.4 18,445.8 0.0 13,341.0 13.341.0 0.0 5,180.0 246.0 4,135.3 4,700.9 51.0 940 43.0 0.0 0.0 NIKE Inc (NKE US) - GAAP In Millions of USD except Per Share 12 Months Ending Revenue + Sales & Services Revenue - Cost of Revenue + Cost of Goods & Services Gross Profit + Other Operating Income - Operating Expenses Selling. General & Admin Research & Development + Other Operating Exponse Operating Income (Loss) - Non-Operating (Income) Loss + Interest Expense, Net Interest Expenso - Interest Incomo + Foreign Exch (Gain) Loss +(Income) Loss from Affiliates Other Non-Op (Income) Loss Pretax income - Income Tax Expense (Benefit) + Current Income Tax + Deferred Income Tax + Tax Allowance Credit income (Loss) from Cont Ops Net Extraordinary Losses (Gains) + Discontinued Operations + XO & Accounting Changes Income (Loss) Incl. Mi - Minority interest Net Income, GAAP - Preferred Dividends - Other Adjustments Net Income Avail to Common, GAAP Net Income Avail to Common, Adj Net Abnormal Losses (Gains) Not Extraordinary Losses (Gains) Basic Weighted Avg Shares Basic EPS, GAAP Basic EPS from Cont Ops Basic EPS from Cont Ops, Adjusted David Weighted Avg Shares Diluted EPS, GAAP Diluted EPS from Cont Ops 4,007.9 66.0 4,325.0 2.392.0 1.745.0 647.0 1950 4,934.0 6160 4,697.3 -78.01 4,801.0) 7720 7380 34.0 3,645.0 4,078.0 4,318,0 0.0 0.0 0.0 4.318.0 0.0 4,318.0 3,645.0 4,078.0 1,933.0 0.0 0.0 0.0 1,933.0 0.0 1,933.0 0.0 0.0 1,933.0 3,933.0 2,000,0 0.0 1.6578 1.17 1.17 2.37 1,659.1 1.17 1.17 4,029.0 0.0 0.0 00 4,029.0 00 4,029.0 0.0 00 4,0290 4,029.0 0.0 0.0 1.579.7 2.55 2.55 2.55 1.6184 2.49 2.49 3,645.0 3,645.0 4,078,0 4,073.0 0.0 4,3180 4,634.0 316.0 0.0 1.558,3 2.75 2.75 296 1.591.6 2.71 2.71 230 2.30 231 2.86 2.56 2.57 2.30 2.30 2.66 2.86 3,645.0 4,078.0 3,645.0 4,078.0 1,933.0 0.0 0.0 0.0 1,933.0 0.0 1,933.0 0.0 0.0 1,933.0 3,933.0 2,000.0 0.0 1.657.8 1.17 1.17 2.37 1.659.1 1.17 1.17 2.37 + Tax Allowance/Credit Income (Loss) from Cont Ops - Net Extraordinary Losses (Gains) + Discontinued Operations + XO & Accounting Changes Income (Loss) Incl. MI - Minority Interest Net Income, GAAP - Preferred Dividends - Other Adjustments Net Income Avail to Common, GAAP Net Income Avail to Common, Adj Net Abnormal Losses (Gains) Net Extraordinary Losses (Gains) Basic Weighted Avg Shares Basic EPS, GAAP Basic EPS from Cont Ops Basic EPS from Cont Ops, Adjusted Diluted Weighted Avg Shares Diluted EPS, GAAP Diluted EPS from Cont Ops Diluted EPS from Cont Ops, Adjusted Reference Items Accounting Standard EBITDA EBITDA Margin (T12M) EBITA EBIT Gross Margin Operating Margin Profit Margin Sales per Employee Dividends per Share Total Cash Common Dividends Depreciation Expense Rental Expense Source: Bloomberg 4,029.0 0.0 0.0 0.0 4,029.0 0.0 4,029.0 0.0 0.0 4,029.0 4,029.0 0.0 0.0 1,579.7 2.55 2.55 2.55 1,618.4 2.49 2.49 2.49 4,318.0 0.0 0.0 0.0 4,318.0 0.0 4,318.0 0.0 0.0 4,318.0 4,634.0 316.0 0.0 1,556.3 2.75 2.75 2.96 1,591.6 2.71 2.71 2.91 3,645.0 3,645.0 4,078.0 4,078.0 2.30 2.30 2.31 2.66 2.66 2.67 2.30 2.30 2.31 2.66 2.66 2.67 4,866.7 12.58 5,5439 13:35 4,135.3 US GAAP 5.192.0 14.26 4,445.0 4,445.0 43.84 12.21 5.31 497,906.98 0.78 1,293.1 747.0 820.0 6,206.0 15.04 5,515,0 5,180.0 44.87 12.55 10.46 4.700.9 US GAAP 5,477.0 14.00 4,772.0 4.772.0 44.67 12.20 10.30 510,000.00 0.86 1.358.5 705.0 829.0 10.69 9.42 1132) 9.82 0.94 1.03 0.93 1,452.8 69101 FY 2016 05/31/2016 FY 2017 05/31/2017 FY 2018 05/31/2018 FY 2019 05/31/2019 5,457.0 3.138.0 2,319.0 3,241.0 3,241,0 0.0 4,838.0 6.179.0 3,808.0 2,371.0 3,677.0 3,677.0 0.0 5,055.0 0.0 0.0 5,055.0 0.0 1.150.0 241.0 5.245.0 4,249.0 996.0 3,498.0 3,498.0 0.0 5,261.0 0.0 0.0 5.261,0 0.0 1.130.0 400.0 4.663.0 4,466.00 1970 4,272,0 4,272.0 0.0 5,622.0 0.0 0.0 5,622.0 0.0 1,968.01 6220 0.0 0.0 0.0 0.0 4,838.0 0.0 1,489.0 496.0 0.0 NIKE Inc (NKE US) - Standardized In Millions of USD except Per Share FY 2015 12 Months Ending 05/31/2015 Total Assets + Cash Cash Equivalents & STI 5,924.0 + Cash & Cash Equivalents 3,852.0 + ST Investments 2,072.0 + Accounts & Notes Receiv 3,358.0 + Accounts Receivable, Net 3,358.0 + Notes Receivable, Net 0.0 + Inventories 4,337.0 * Raw Materials + Work In Process + Finished Goods 4,337.0 + Other Inventory 0.0 + Other ST Assets 1,968.0 + Derivative & Hedging Assets 1,114.0 + Deferred Tax Assets + Discontinued Operations 0.0 + Misc ST Assets 854.0 Total Current Assets 15,587.0 + Property. Plant & Equip, Net 3,011.0 + Property. Plant & Equip 6,352.0 - Accumulated Depreciation 3,341.0 +LT Investments & Receivables 0.0 + Other LT Assets 2,999.0 + Total Intangible Assets 412.0 + Goodwill 131.0 + Other Intangible Assets 281.01 + Deferred Tax Assets + Derivative & Hedging Assets 5250 + Misc LT Assets 2,062.0 Total Noncurrent Assets 6,010.0 Total Assets 21,597.0 Liabilities & Shareholders' Equity + Payables & Accruals 5,989.0 + Accounts Payable 2,131.0 + Accrued Taxes 243.0 + Interest & Dividends Payable 240.0 *Other Payables & Accruals 3,375.0 + ST Debt 181.0 + ST Borrowings 74,0 + ST Lonso Liabilities - ST Finance Less . Current Portion of LT Debt 107.0 + Other ST Liabilities 162.0 + Datorred Revenue 0.0 0.0 993.0 15,025.0 3,520.0 7,038.0 3,518.0 0.0 2,834.0 412.0 131.0 281.01 909.0 16,061.0 3,989.0 7,958.0 3.969.0 0.0 3,209.0 4220 139.0 283.0 2,787.0 0.0 0.0 7,198.0 23,259.0 00 730.0 15,134.0 4.4540 8,891.0 4.437.0 0.01 2.948.0 439.0 1540 285.00 2,509.0 0.0 0.0 7,402.0 22,536.0 0.0 1,346.0 16,525.0 4,744.0 9.469.0 4.7250 0.0 2,448.0 4370 1540 283.0 2011.0 0.0 0.0 7,192.0 23,717.0 121.0 2,3010 6,354.0 21,379.0 5,152.0 2,1910 2440 2710 2.446.0 45.0 1.0 4.889.0 2,048.0 280.0 300,0 2.261.0 3310 3250 5,508.0 2.279.0 374.0 320.0 2.5350 342.0 3360 7,797.0 2,6120 463.0 346.0 4.3780 150 9.0 44.0 161.0 0.0 6.0 2540 60 1900 00 6.0 540 0.0 0.0 1900 0.0 190.0 620 0.0 54.0 TOZU 0.0 162.0 0.0 0.0 6,332.0 1,079.0 1,079.0 16101 0.0 161.0 0.0 0.0 5,358.0 1.993.0 1.993.0 2294 0.0 254.0 0.0 0.0 5,474.0 3.471.0 3,471.0 0.0 6,040.0 3,468.00 3,468.00 0.0 7,866.0 3.484.0 3,464.0 3,347.0 0.0 0.0 POTET SILS + Deferred Revenue + Derivatives & Hedging Discontinued Operations + Misc ST Liabilities Total Current Liabilities +LT Debt +LT Borrowings + LT Lease Liabilities *LT Finance Leases +Other LT Liabilities + Accrued Liabilities Pension Liabilities + Pensions + Other Post-Ref Bonolits + Deferred Revenue *Deferred Tax Liabilities + Derivatives & Hedging +Mise LT Liabilities Total Noncurrent Liabilities Total Liabilities + Preferred Equity and Hybrid Capital + Share Capital & APIC + Common Stock Additional Paid in Capital Treasury Stock Retained Earnings Other Equity Equity Before Minority interest Minority/Non Controlling Interest Total Equity Total Liabilities & Equity Reference Items Accounting Standard Shares Outstanding Number of Treasury Shares Pension Obligations Future Minimum Operating Lease Obligation Capital Leases. Total Options Granted During Period Options Outstanding at Period End Net Debt Net Debt to Equity Tangible Common Equity Ratio Current Ratio Cash Conversion Cycle Cash Held Overseas Number of Employees 1,479.0 0.01 0.0 0.0 0.0 0.0 351.0 13.0 1.115.0 2,558.0 8,890.0 0.0 6,776,0 3.0 6,773.0 0.0 4.685.0 1.246.0 12,707.0 0.0 12,707.0 21,597.0 1,770.0 0.0 0.0 0.0 0.0 0.0 364.0 38.0 1,368.0 3.763.0 9,121.0 0.0 7.789.0 3.0 7.7860 0.0 4,151.0 318,00 12,258.0 0.0 12,258.00 21,379.0 1,907.01 0.0 0.0 0.0 0.0 0.0 1,907.0 0.0 0.0 5,378.0 10.8520 00 5,7130 3.0 5,710.0 0.0 6,907.0 -213.0 12,407.0 0.0 12,407.0 23,259.0 3,216.0 0.0 0.0 0.0 0.0 0.0 3.216.00 0.0 0.0 6,684.0 12.724.0 0.0 6,3870 3.0 8,384.0 0.0 3.5170 -920 9,812.0 0.0 9,812.0 22,536.0 0.0 0.0 3.347.0 0.0 0.0 6,811.0 14,677.0 0.01 7.166.0 3.0 7,1630 0.0 1,843.00 231.0 9,040.0 0.0 9,040.0 23,717.0 US GAAP 1.843.0 US GAAP 1,714.01 0.0 0.0 2,974.0 US GAAP 1,6820 0.0 0.0 3.231.0 0.0 US GAAP 1.6010 0.0 0.0 3.9650 US GAAP 1.5680 0.0 0.0 3,732.0 0.01 3,9050 92 58.1 -4,6640 -36.70 58.04 2.46 88.15 4,200.0 62.600.00 20.6 112.0 -3.419.0 -27.89 56.50 2.80 39.60 4,600.0 70.700.00 12.2 1048 -2.377.0 -19.16 52.48 2.93 91.41 5,800.0 74 400.00 168 932 -1.435.0 - 14.62 42.42 2.51 89.83 5.2000 73.100.00 18.1 91.3 -1.1840 -13.10 36 95 2.10 87.45 4.466.0 76,700.00 1 pts Question 3 What is the weight of equity for Nike? O97.86% 2.14% 100% 50.00% Question 4 1 pts What is the Nike's dividend per share in 2019? O $0.86 $0.78 $0.93 $1.03 Nike did not pay dividends in 2019 Question 5 1 pts What is Nike's approximate cost of equity? 5.90% 4.86% 3.78% 2.99% 5% Question 6 1 pts What is your approximate estimate of Nike's WACC based on the worksheet? 5.83% 5.90% O 5.0% 3.78% 9.68% Question 7 1 pts What is Nike's Market Capitalization at the end of 2019? O $158,054 million $100,800 million $9,040 million $9,812 million Question 8 1 pts What is the amount of Nike's long term debt in 2019? $3,464 million $7,866 million $3,347 million $6,811 million O $14,677 million 1 pts Question 9 What is the approximate weight of debt for Nike? 2.14% 97.86% 3.78% 96.22% 50.00% Question 10 1 pts One limitation of our analysis is that the model for finding the cost of equity assumes constant growth in dividends. This may not be a reasonable assumption for a company like Nike that is still growing. O True False