I. USE THE INFORMATION BELOW TO ANSWER PROBLEMS 1 THROUGH NN. 1. Which of the following two variables are both quantitative and continuous? 1. The
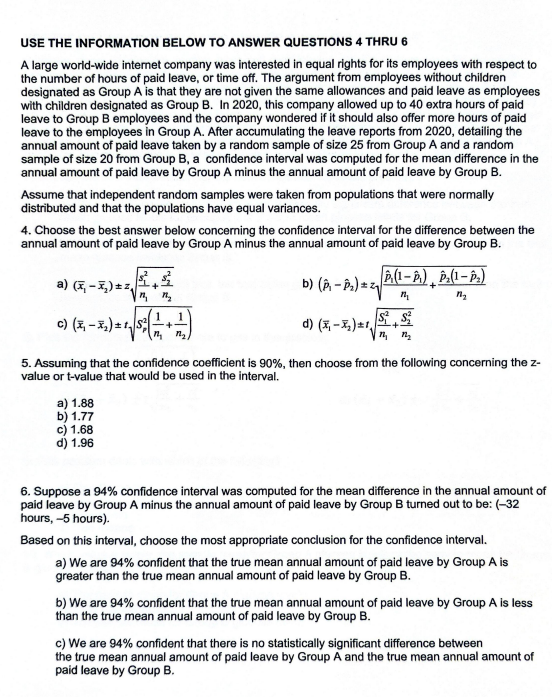
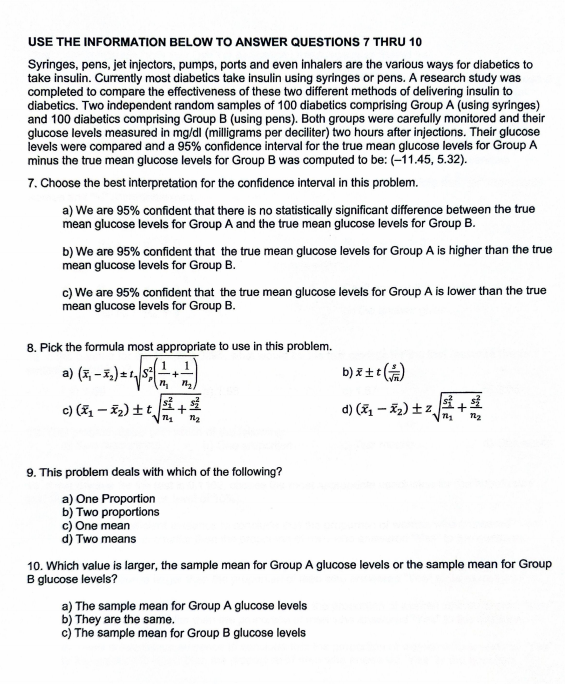
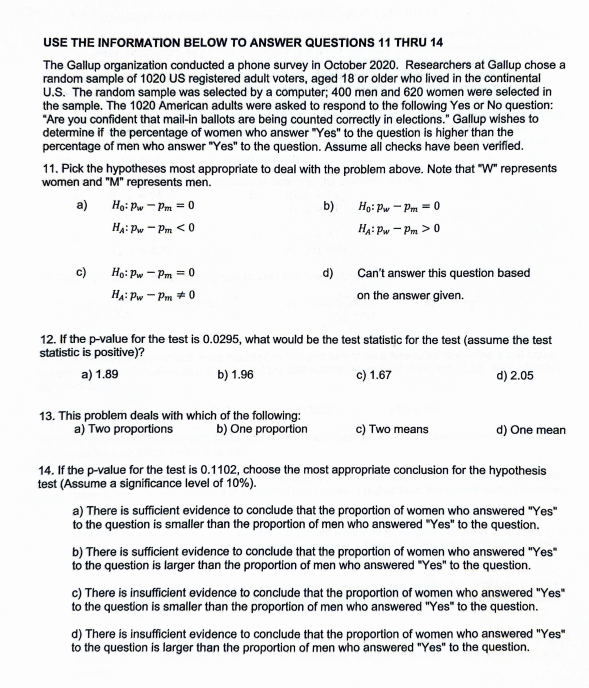
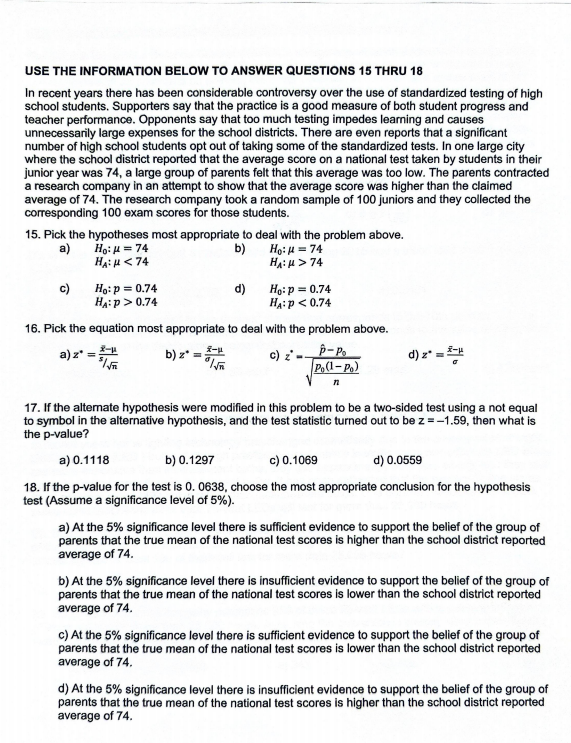
I. USE THE INFORMATION BELOW TO ANSWER PROBLEMS 1 THROUGH NN. 1. Which of the following two variables are both quantitative and continuous? 1. The lifetime of a light bulb. 2. The manufacturer of a new automobile. 3. The number of passes thrown by a quarterback in a football game. 4. The time it takes to cook a vegetable for dinner. a) 1 and 4 b) 1 and 2 c) 1 and 3 d) 2 and 4 USE THE INFORMATION BELOW TO ANSWER QUESTIONS 2 AND 3 Below is a histogram displaying the quiz scores of a class of 35 students, with scores ranging between 10 and 100. :10- 20 70 180 Quiz Score 2. Choose the statement that best describes the distribution. a) The distribution is mound-shaped and symmetric b) The range is approximately 60 c) The median is larger than the mean d) Approximately 75% of the student quiz scores are above 40 3. Choose an estimate for the median and the mean that best fit this distribution. a) median = 78 and mean = 72 b) median = 79 and mean = 77 c) median = 83 and mean = 79 d) median = 84 and mean = 85USE THE INFORMATION BELOW TO ANSWER QUESTIONS 4 THRU 6 A large world-wide internet company was interested in equal rights for its employees with respect to the number of hours of paid leave, or time off. The argument from employees without children designated as Group A is that they are not given the same allowances and paid leave as employees with children designated as Group B. In 2020, this company allowed up to 40 extra hours of paid leave to Group B employees and the company wondered if it should also offer more hours of paid leave to the employees in Group A. After accumulating the leave reports from 2020, detailing the annual amount of paid leave taken by a random sample of size 25 from Group A and a random sample of size 20 from Group B, a confidence interval was computed for the mean difference in the annual amount of paid leave by Group A minus the annual amount of paid leave by Group B. Assume that independent random samples were taken from populations that were normally distributed and that the populations have equal variances. 4. Choose the best answer below concerning the confidence interval for the difference between the annual amount of paid leave by Group A minus the annual amount of paid leave by Group B. b) (P - P,) =z Pill- P) , P(1 -P.) C) (7 -X,) +1 82 141 d) (7, - ,) =1 5. Assuming that the confidence coefficient is 90%, then choose from the following concerning the z- value or t-value that would be used in the interval. a) 1.88 b) 1.77 C) 1.68 d) 1.96 6. Suppose a 94% confidence interval was computed for the mean difference in the annual amount of paid leave by Group A minus the annual amount of paid leave by Group B turned out to be: (-32 hours, -5 hours). Based on this interval, choose the most appropriate conclusion for the confidence interval. a) We are 94% confident that the true mean annual amount of paid leave by Group A is greater than the true mean annual amount of paid leave by Group B. b) We are 94% confident that the true mean annual amount of paid leave by Group A is less than the true mean annual amount of paid leave by Group B. c) We are 94% confident that there is no statistically significant difference between the true mean annual amount of paid leave by Group A and the true mean annual amount of paid leave by Group B.USE THE INFORMATION BELOW TO ANSWER QUESTIONS 7 THRU 10 Syringes, pens, jet injectors, pumps, ports and even inhalers are the various ways for diabetics to take insulin. Currently most diabetics take insulin using syringes or pens. A research study was completed to compare the effectiveness of these two different methods of delivering insulin to diabetics. Two independent random samples of 100 diabetics comprising Group A (using syringes) and 100 diabetics comprising Group B (using pens). Both groups were carefully monitored and their glucose levels measured in mg/dl (milligrams per deciliter) two hours after injections. Their glucose levels were compared and a 95% confidence interval for the true mean glucose levels for Group A minus the true mean glucose levels for Group B was computed to be: (-11.45, 5.32). 7. Choose the best interpretation for the confidence interval in this problem. a) We are 95% confident that there is no statistically significant difference between the true mean glucose levels for Group A and the true mean glucose levels for Group B. b) We are 95% confident that the true mean glucose levels for Group A is higher than the true mean glucose levels for Group B. c) We are 95% confident that the true mean glucose levels for Group A is lower than the true mean glucose levels for Group B. B. Pick the formula most appropriate to use in this problem. a) (5 - 1,)+1 82 1+1 b) itt ( ) c) (1 1 -x2) tti45 d) (x1 - x2) +z 9. This problem deals with which of the following? a) One Proportion b) Two proportions c) One mean d) Two means 10. Which value is larger, the sample mean for Group A glucose levels or the sample mean for Group B glucose levels? a) The sample mean for Group A glucose levels b) They are the same. c) The sample mean for Group B glucose levelsUSE THE INFORMATION BELOW TO ANSWER QUESTIONS 11 THRU 14 The Gallup organization conducted a phone survey in October 2020. Researchers at Gallup chose a random sample of 1020 US registered adult voters, aged 18 or older who lived in the continental U.S. The random sample was selected by a computer; 400 men and 620 women were selected in the sample. The 1020 American adults were asked to respond to the following Yes or No question: "Are you confident that mail-in ballots are being counted correctly in elections." Gallup wishes to determine if the percentage of women who answer "Yes" to the question is higher than the percentage of men who answer "Yes" to the question. Assume all checks have been verified. 11. Pick the hypotheses most appropriate to deal with the problem above. Note that "W" represents women and "M" represents men. a) Ho: Pw - Pm = 0 b) Ho: Pw - Pm= 0 HA: Pw - Pm 0 c) Ho: Pw - Pm = 0 d) Can't answer this question based HA: Pw - Pm # 0 on the answer given. 12. If the p-value for the test is 0.0295, what would be the test statistic for the test (assume the test statistic is positive)? a) 1.89 b) 1.96 c) 1.67 d) 2.05 13. This problem deals with which of the following: a) Two proportions b) One proportion c) Two means d) One mean 14. If the p-value for the test is 0.1102, choose the most appropriate conclusion for the hypothesis test (Assume a significance level of 10%). a) There is sufficient evidence to conclude that the proportion of women who answered "Yes" to the question is smaller than the proportion of men who answered "Yes" to the question. b) There is sufficient evidence to conclude that the proportion of women who answered "Yes" to the question is larger than the proportion of men who answered "Yes" to the question. c) There is insufficient evidence to conclude that the proportion of women who answered "Yes" to the question is smaller than the proportion of men who answered "Yes" to the question. d) There is insufficient evidence to conclude that the proportion of women who answered "Yes" to the question is larger than the proportion of men who answered "Yes" to the question.USE THE INFORMATION BELOW TO ANSWER QUESTIONS 15 THRU 18 In recent years there has been considerable controversy over the use of standardized testing of high school students. Supporters say that the practice is a good measure of both student progress and teacher performance. Opponents say that too much testing impedes learning and causes unnecessarily large expenses for the school districts. There are even reports that a significant number of high school students opt out of taking some of the standardized tests. In one large city where the school district reported that the average score on a national test taken by students in their junior year was 74, a large group of parents felt that this average was too low. The parents contracted a research company in an attempt to show that the average score was higher than the claimed average of 74. The research company took a random sample of 100 juniors and they collected the corresponding 100 exam scores for those students. 15. Pick the hypotheses most appropriate to deal with the problem above. a) Ho: M = 74 b) Ho:H = 74 HAH 74 c) Ho: p = 0.74 d) Ho: p = 0.74 HA: p >0.74 HA:P
Step by Step Solution
There are 3 Steps involved in it
Step: 1
Get Instant Access to Expert-Tailored Solutions
See step-by-step solutions with expert insights and AI powered tools for academic success
Step: 2
Step: 3
Ace Your Homework with AI
Get the answers you need in no time with our AI-driven, step-by-step assistance