Answered step by step
Verified Expert Solution
Question
1 Approved Answer
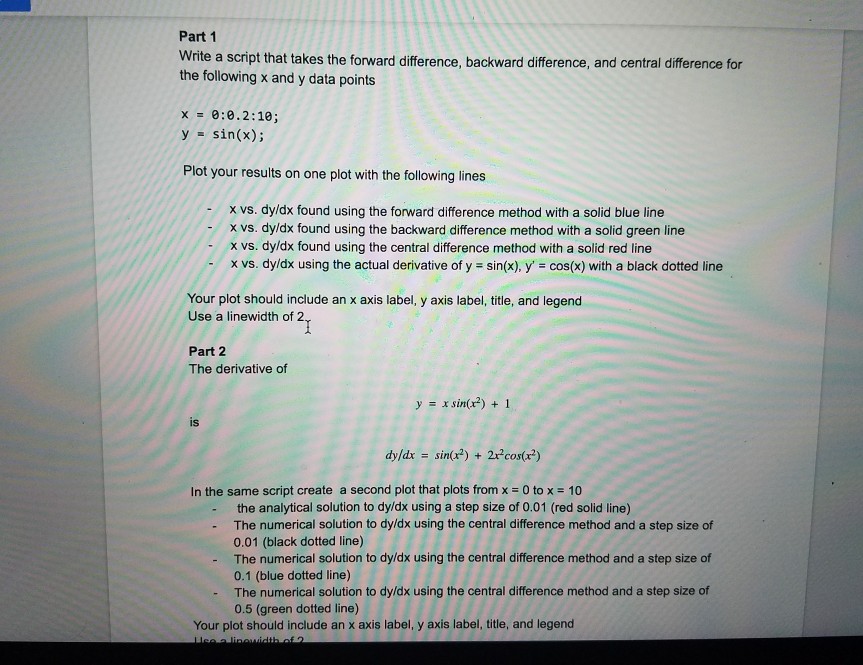
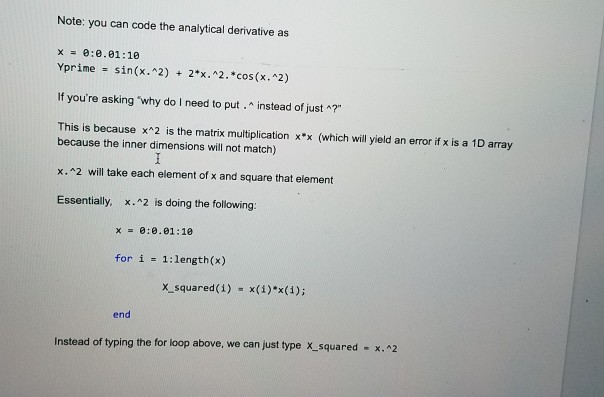
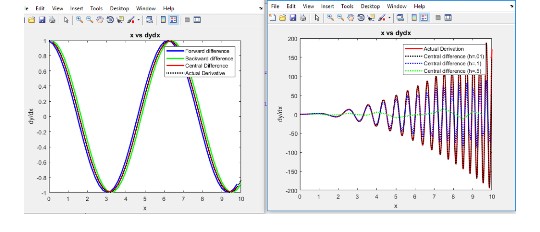
I want the matlab code. and following are the pictures how graph for each part look like after running the code. Part 1 Write a


I want the matlab code. and following are the pictures how graph for each part look like after running the code.

Part 1 Write a script that takes the forward difference, backward difference, and central difference for the following x and y data points x0:0.2:10; y sin(x) Plot your results on one plot with the following lines - x vs. dy/dx found using the forward difference method with a solid blue line -/ x vs. dy/dx found using the backward difference method with a solid green line x vs. dyldx found using the central difference method with a solid red line x vs. dyldx using the actual derivative of y sin(x), y cos(x) with a black dotted line Your plot should include an x axis label, y axis label, title, and legend Use a linewidth of 2 Part 2 The derivative of y x sin(2) 1 is dy/dx = sin(x2) + 2x3cos(x2) In the same script create a second plot that plots from x 0 to x 10 - the analytical solution to dy/dx using a step size of 0.01 (red solid line) - The numerical solution to dyldx using the central difference method and a step size of 0.01 (black dotted line) The numerical solution to dy/dx using the central difference method and a step size of 0.1 (blue dotted line) The numerical solution to dyldx using the central difference method and a step size of 0.5 (green dotted line) Your plot should include an x axis label, y axis label, title, and legend
Step by Step Solution
There are 3 Steps involved in it
Step: 1

Get Instant Access to Expert-Tailored Solutions
See step-by-step solutions with expert insights and AI powered tools for academic success
Step: 2

Step: 3

Ace Your Homework with AI
Get the answers you need in no time with our AI-driven, step-by-step assistance
Get Started


