Answered step by step
Verified Expert Solution
Link Copied!

Question

1 Approved Answer

I want to create a 7 day moving average as a line plot of the total cases from this sample data in python. How do

I want to create a 7 day moving average as a line plot of the total cases from this sample data in python. How do I proceed with this with matplotlib or other libraries?
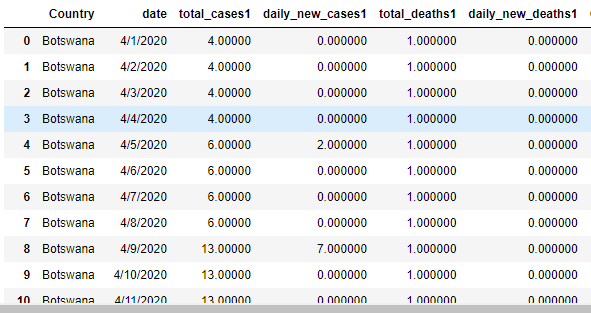
image text in transcribed

Country 0 Botswana 1 Botswana 2 Botswana 3 Botswana 4 Botswana date total_cases1 daily_new_cases1 total_deaths1 daily_new_deaths1 4/1/2020 4.00000 0.000000 1.000000 0.000000 4/2/2020 4.00000 0.000000 1.000000 0.000000 4/3/2020 4.00000 0.000000 1.000000 0.000000 4/4/2020 4.00000 0.000000 1.000000 0.000000 4/5/2020 6.00000 2.000000 1.000000 0.000000 4/6/2020 6.00000 0.000000 1.000000 0.000000 4/7/2020 6.00000 0.000000 1.000000 0.000000 4/8/2020 6.00000 0.000000 1.000000 0.000000 4/9/2020 13.00000 7.000000 1.000000 0.000000 4/10/2020 13.00000 0.000000 1.000000 0.000000 4/11/2020 1300000 0000000 1000000 5 Botswana 6 Botswana 7 Botswana 8 Botswana 9 Botswana 10 Botswana nnnnnnn

Step by Step Solution

There are 3 Steps involved in it

Step: 1

blur-text-image

Get Instant Access to Expert-Tailored Solutions

See step-by-step solutions with expert insights and AI powered tools for academic success

Step: 2

blur-text-image

Step: 3

blur-text-image

Ace Your Homework with AI

Get the answers you need in no time with our AI-driven, step-by-step assistance

Get Started

Recommended Textbook for

Oracle 10g Database Administrator Implementation And Administration

Authors: Gavin Powell, Carol McCullough Dieter

2nd Edition

1418836656, 9781418836658

More Books

Students also viewed these Databases questions