Answered step by step
Verified Expert Solution
Question
1 Approved Answer
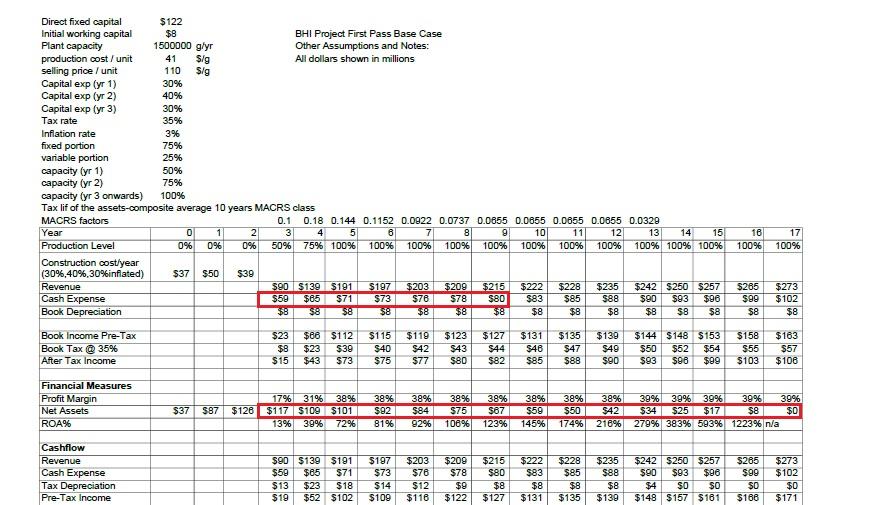
I want to know how the values selected in the red boxes are calculated. I need a formula or explanation to calculate the values. 30%

I want to know how the values selected in the red boxes are calculated. I need a formula or explanation to calculate the values.
30% Direct fixed capital $122 Initial working capital $8 BHI Project First Pass Base Case Plant capacity 1500000 glyr Other Assumptions and Notes: production cost / unit 41 Sig All dollars shown in millions selling price / unit 110 Sig Capital exp (yr 1) Capital exp (yr 2) 40% Capital exp (yr 3) 30% Tax rate 35% Inflation rate 3% fixed portion 75% variable portion 25% capacity lyr 1) 50% capacity lyr 2) 75% capacity (yr 3 onwards) 100% Tax lif of the assets-composite average 10 years MACRS class MACRS factors 0.1 0.18 0.144 0.1152 0.0922 0.0737 0.0655 0.0655 0.0655 0.0655 0.0329 Year 0 1 2 3 4 5 6 8 9 10 11 12 13 14 15 Production Level 0% 0% 0% 50% 75% 100% 100% 100% 100% 100% 100% 100% 100% 100% 100% 100% Construction cost/year (30% 40%,30%inflated) $37 $50 $39 Revenue $90 $139 $191 $197 $203 $209 $215 $222 $228 $235 $242 $250 $257 Cash Expense $50 $65 $71 $73 $76 $78 $83 $85 $88 $90 $93 $96 Book Depreciation $8 $8 $8 $8 $8 $8 $8 $8 $8 $8 $8 $8 $8 16 100% 17 100% $80 $265 $90 $8 $273 $102 $8 Book Income Pre-Tax Book Tax @ 35% After Tax Income $23 $8 $15 $66 $112 $23 $39 $43 $73 $115 $40 $75 $119 $42 $77 $123 $43 $80 $127 $44 $82 $131 $46 $85 $135 $47 $88 $139 $49 $90 $144 $148 $153 $50 $52 $54 $93 $98 $99 $158 $55 $103 $163 $57 $106 Financial Measures Profit Margin Net Assets ROA% $37 S87 17% 31% 38% $126 $117 $109 $101 13% 39% 72% 38% $92 81% 38% 38% $84 $75 92% 100% 38% $67 123% 38% $59 145% 38% 38% $50 $42 174% 218% 39% 39% 39% 39% 39% $34 $25 $17 $8 $0 279% 383% 593% 1223% n/a $222 Cashflow Revenue Cash Expense Tax Depreciation Pre-Tax Income $90 $139 $191 $59 $85 $71 $13 $23 $18 $19 $52 $102 $197 $73 $14 $109 $203 $70 $12 $118 $209 $78 $9 $122 $215 $80 $8 $127 $83 $8 $131 $228 $85 $8 $135 $235 $88 $8 $139 $242 $250 $257 $90 $93 $96 $4 $O $0 $148 $157 $161 $265 $90 $0 $166 $273 $102 $0 $171Step by Step Solution
There are 3 Steps involved in it
Step: 1

Get Instant Access to Expert-Tailored Solutions
See step-by-step solutions with expert insights and AI powered tools for academic success
Step: 2

Step: 3

Ace Your Homework with AI
Get the answers you need in no time with our AI-driven, step-by-step assistance
Get Started


