I was hoping you could provide a sanity check on my responses (highlighted). I am really not sure of my last response. Any suggestions/guidance would
I was hoping you could provide a sanity check on my responses (highlighted). I am really not sure of my last response. Any suggestions/guidance would be appreicated.
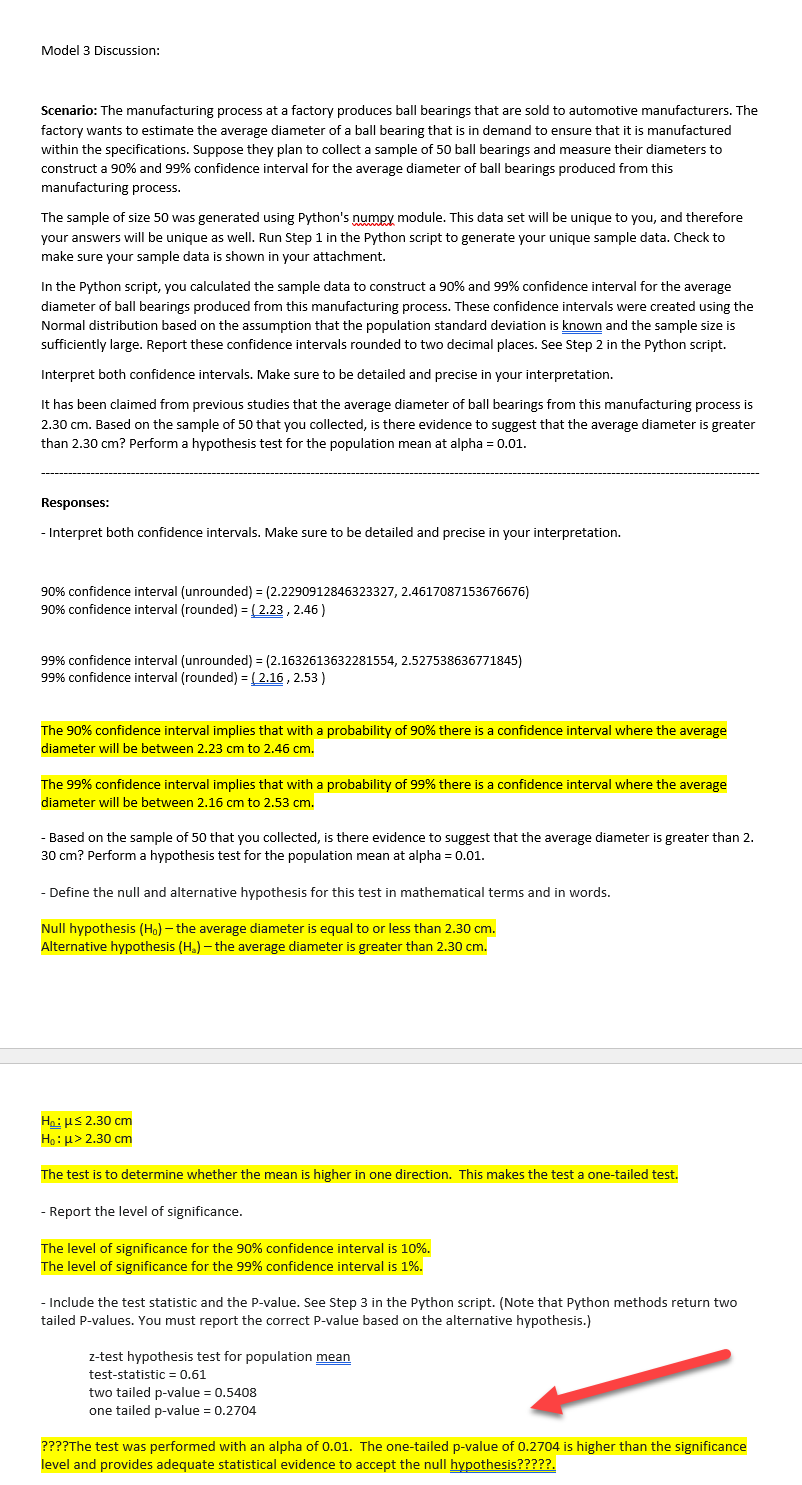
Model 3 Discussion: Scenario: The manufacturing process at a factory produces ball bearings that are sold to automotive manufacturers. The factory wants to estimate the average diameter of a ball bearing that is in demand to ensure that it is manufactured within the specifications. Suppose they plan to collect a sample of 50 ball bearings and measure their diameters to construct a 90% and 99% confidence interval for the average diameter of ball bearings produced from this manufacturing process. The sample of size 50 was generated using Python's numpy module. This data set will be unique to you, and therefore your answers will be unique as well. Run Step 1 in the Python script to generate your unique sample data. Check to make sure your sample data is shown in your attachment. In the Python script, you calculated the sample data to construct a 90% and 99% con denoe interval for the average diameter of ball bearings produced from this manufacturing process. These confidence intervals were created using the Normal distribution based on the assumption that the population standard deviation is known and the sample size is sufciently large. Report these confidence intervals rounded to two decimal places. See Step 2 in the Python script. Interpret both condence intervals. Make sure to be detailed and precise in your interpretation. It has been claimed from previous studies that the average diameter of ball bearings from this manufacturing process is 2.30 cm. Based on the sample of 50 that you collected, is there evidence to suggest that the average diameter is greater than 2.30 cm? Perform a hypothesis test for the population mean at alpha = 0.01. Responses: Interpret both condence intervals. Make sure to be detailed and precise in your interpretation. 90% condence interval [unrounded] = (2.2290912846323322, 2.461?08?1536?66?6} 90% condence interval (rounded) = g 2.23, 2.45} 99% condence interval [unrounded} = (2.1532613632281554, 2.522538635221845] 99% condence interval (rounded) = g 2.15, 2.53} The 90% condence interval implies that with a probability of 90% there is a condence interval where the average diameter will be between 2.23 cm to 2.45 cm. The 99% condence interval implies that with a probability of 99% there is a condence interval where the average diameter will be between 2.16 cm to 2.53 cm. Based on the sample of 50 that you collected, is there evidence to suggest that the average diameter is greater than 2. 30 cm? Perform a hypothesis test for the population mean at alpha = 0.01. Define the null and alternative hypothesis for this test in mathematical terms and in words. Null hypothesis [Ha] the average diameter is equal to or less than 2.30 cm. Alternative hypothesis [Ha] the average diameter is greater than 2.30 cm. Hg__: [15 2.30 cm H9: p.) 2.30 cm The test is to determine whether the mean is higher in one direction. This makes the test a onetailed test. Report the level of significance. The level of significance for the 90% confidence interval is 10%. The level of significance for the 99% confidence interval is 1%. Include the test statistic and the Pvalue. See Step 3 in the Python script. {Note that Python methods return two tailed P-values. You must report the correct P-value based on the alternative hypothesis] ztest hypothesis test for population teststatistic = 0.61 two tailed pvalue = 0.5408 one tailed p-value = 0.2704 ????The test was performed with an alpha of 0.01. The onetailed pvalue of 02204 is higher than the significance level and provides adequate statistical evidence to accept the null hypothesis
Step by Step Solution
There are 3 Steps involved in it
Step: 1
Get Instant Access to Expert-Tailored Solutions
See step-by-step solutions with expert insights and AI powered tools for academic success
Step: 2
Step: 3
Ace Your Homework with AI
Get the answers you need in no time with our AI-driven, step-by-step assistance