Answered step by step
Verified Expert Solution
Link Copied!

Question

1 Approved Answer

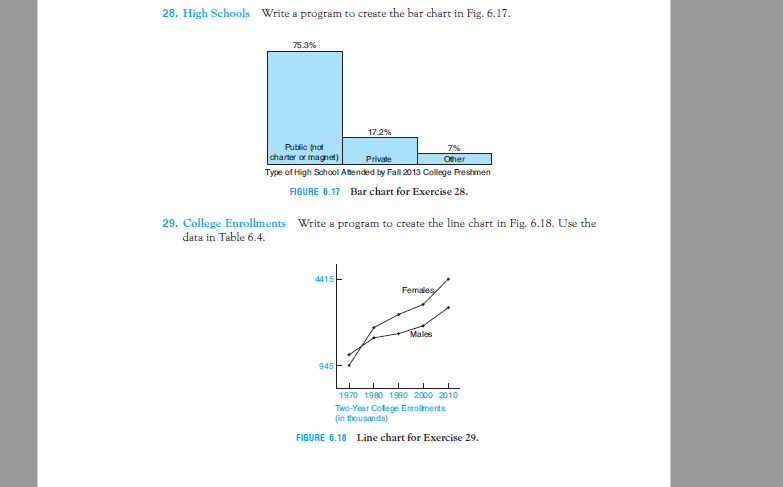
i was wondering how to do 28 and 29 28. High Schools Write a program to creste the bar chart in Fig. 6.17 75.3% 172%

i was wondering how to do 28 and 29

image text in transcribed

28. High Schools Write a program to creste the bar chart in Fig. 6.17 75.3% 172% Public not charter or magnet) 7% Oher Private Type of High School Atended by Fall 2013 College Freshmen FIGURE 6.17 Bar chart for Exercise 28. 29. College Enrollments data in Table 6.4 Write a program to create the line chart in Fig. 6.18. Use the 4415 945 1970 1900 1990 2000 2010 Two-Year Colege Enrollments (in thousands) FIGURE 6.18 Line chart for Exercise 29

Step by Step Solution

There are 3 Steps involved in it

Step: 1

blur-text-image

Get Instant Access to Expert-Tailored Solutions

See step-by-step solutions with expert insights and AI powered tools for academic success

Step: 2

blur-text-image

Step: 3

blur-text-image

Ace Your Homework with AI

Get the answers you need in no time with our AI-driven, step-by-step assistance

Get Started

Students also viewed these Databases questions