 I will rate you, thanks
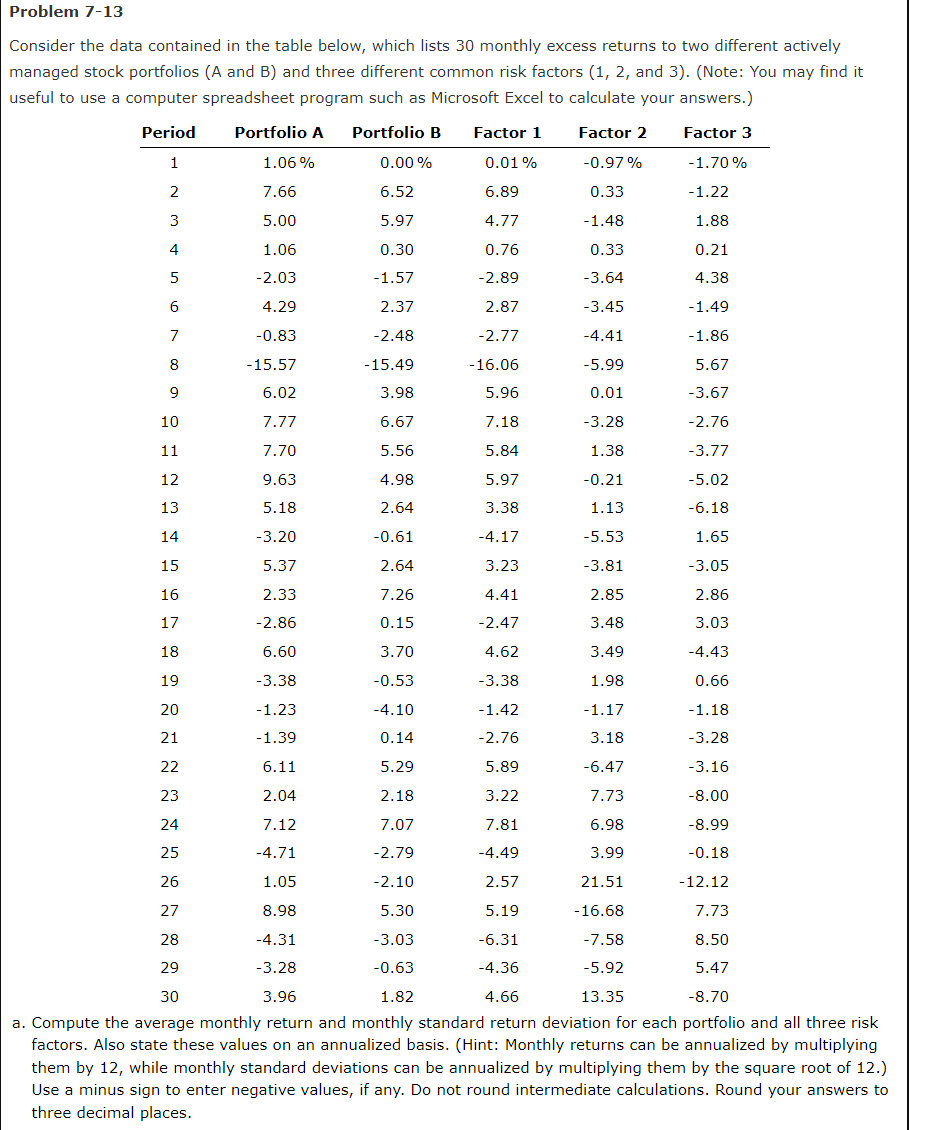
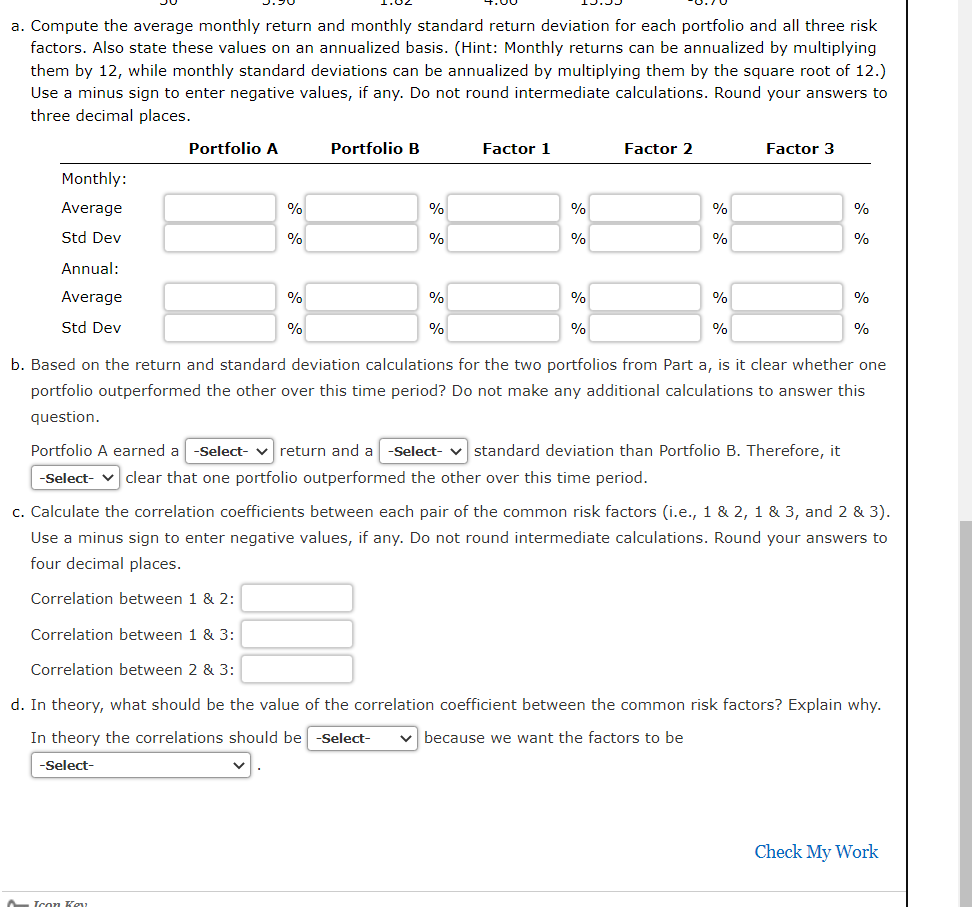
Consider the data contained in the table below, which lists 30 monthly excess returns to two different actively managed stock portfolios (A and B) and three different common risk factors (1, 2, and 3). (Note: You may find it useful to use a a. Compute th II three risk factors. Also state these values on an annualized basis. (Hint: Monthly returns can be annualized by multiplying them by 12 , while monthly standard deviations can be annualized by multiplying them by the square root of 12 .) Use a minus sign to enter negative values, if any. Do not round intermediate calculations. Round your answers to three decimal places. a. Compute the average monthly return and monthly standard return deviation for each portfolio and all three risk factors. Also state these values on an annualized basis. (Hint: Monthly returns can be annualized by multiplying them by 12 , while monthly standard deviations can be annualized by multiplying them by the square root 12 .) Use a minus sign to enter negative values, if any. Do not round intermediate calculations. Round your answers to three decimal places. b. Based on the return and standard deviation calculations for the two portfolios from Part a, is it clear whether one portfolio outperformed the other over this time period? Do not make any additional calculations to answer this question. Portfolio A earned a return and a standard deviation than Portfolio B. Therefore, it clear that one portfolio outperformed the other over the c. Calculate the correlation coefficients between each pair of the common risk factors (i.e., 1 \& 2, 1 \& 3 , and 2 \& 3 ). Use a minus sign to enter negative values, if any. Do not round intermediate calculations. Round your answers to four decimal places. Correlation between 1 \& 2 : Correlation between 1 \& 3 : Correlation between 2 \& 3 : d. In theory, what should be the value of the correlation coefficient between the common risk factors? Explain why. In theory the correlations should be because we want the factors to be Consider the data contained in the table below, which lists 30 monthly excess returns to two different actively managed stock portfolios (A and B) and three different common risk factors (1, 2, and 3). (Note: You may find it useful to use a a. Compute th II three risk factors. Also state these values on an annualized basis. (Hint: Monthly returns can be annualized by multiplying them by 12 , while monthly standard deviations can be annualized by multiplying them by the square root of 12 .) Use a minus sign to enter negative values, if any. Do not round intermediate calculations. Round your answers to three decimal places. a. Compute the average monthly return and monthly standard return deviation for each portfolio and all three risk factors. Also state these values on an annualized basis. (Hint: Monthly returns can be annualized by multiplying them by 12 , while monthly standard deviations can be annualized by multiplying them by the square root 12 .) Use a minus sign to enter negative values, if any. Do not round intermediate calculations. Round your answers to three decimal places. b. Based on the return and standard deviation calculations for the two portfolios from Part a, is it clear whether one portfolio outperformed the other over this time period? Do not make any additional calculations to answer this question. Portfolio A earned a return and a standard deviation than Portfolio B. Therefore, it clear that one portfolio outperformed the other over the c. Calculate the correlation coefficients between each pair of the common risk factors (i.e., 1 \& 2, 1 \& 3 , and 2 \& 3 ). Use a minus sign to enter negative values, if any. Do not round intermediate calculations. Round your answers to four decimal places. Correlation between 1 \& 2 : Correlation between 1 \& 3 : Correlation between 2 \& 3 : d. In theory, what should be the value of the correlation coefficient between the common risk factors? Explain why. In theory the correlations should be because we want the factors to be