I will really appreciate some help with my economics work. I've been struggling in economics 2370 and would love some help. Thank you so much :)
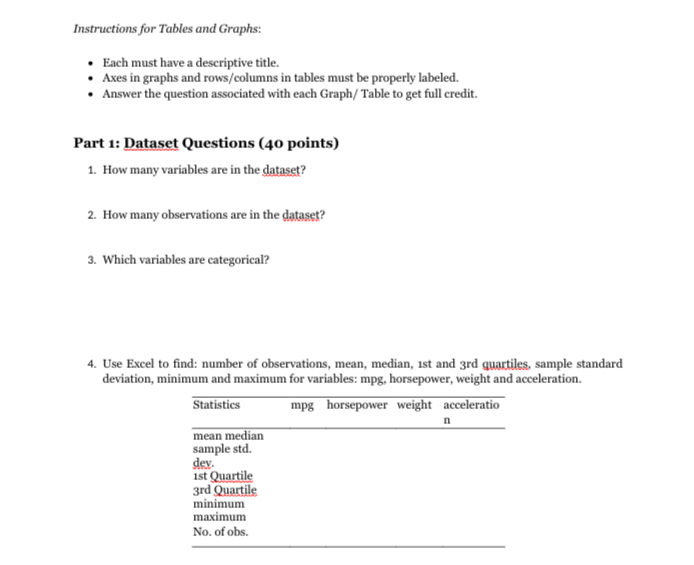
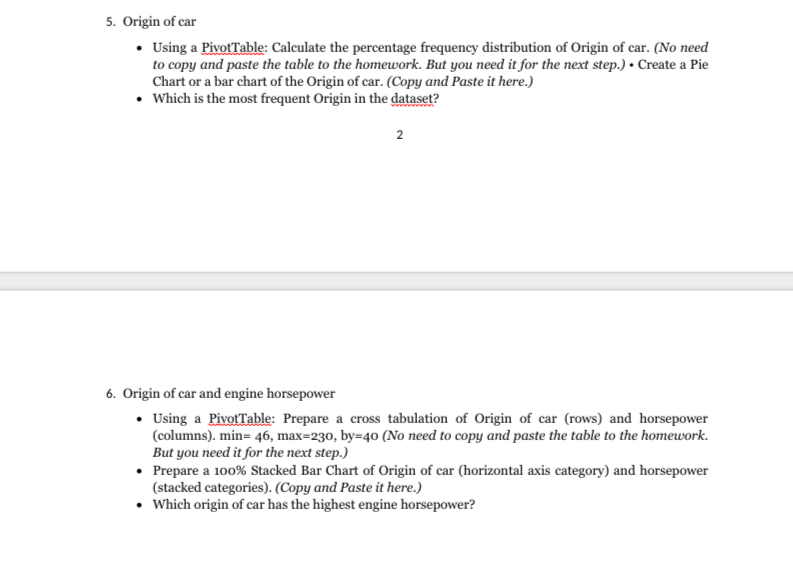
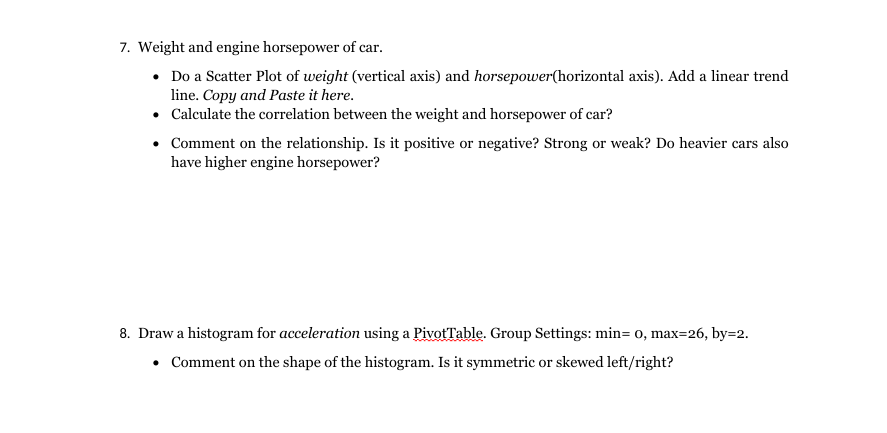
A dataset for a sample of vehicles Download the following file from Blackboard: auto.xlsx This dataset contains gas mileage, horsepower, and other information for a sample of vehicles and was taken from the StatLib library which is maintained at Carnegie Mellon University. The dataset was used in the 1983 American Statistical Association Exposition. Description of Variables: mpg miles per gallon cylinders Number of cylinders between 4 and 8 displacement Engine displacement (cu. inches) horsepower Engine horsepower weight Vehicle weight (Ibs.) acceleration Time to accelerate from o to 60 mph (sec.) year Model year (modulo 100) origin Origin of car (1= American, 2= European, 3= Japanese) name Vehicle nameInstructions for Tables and Graphs: . Each must have a descriptive title. . Axes in graphs and rows/columns in tables must be properly labeled. Answer the question associated with each Graph/ Table to get full credit. Part 1: Dataset Questions (40 points) 1. How many variables are in the dataset? 2. How many observations are in the dataset? 3. Which variables are categorical? 4. Use Excel to find: number of observations, mean, median, ist and ard quartiles, sample standard deviation, minimum and maximum for variables: mpg, horsepower, weight and acceleration. Statistics mpg horsepower weight acceleration mean median sample std. dev. ist Quartile 3rd Quartile minimum maximum No. of obs.5. Origin of car . Using a PivotTable: Calculate the percentage frequency distribution of Origin of car. (No need to copy and paste the table to the homework. But you need it for the next step.) . Create a Pie Chart or a bar chart of the Origin of car. (Copy and Paste it here.) . Which is the most frequent Origin in the dataset? 2 6. Origin of car and engine horsepower . Using a PivotTable: Prepare a cross tabulation of Origin of car (rows) and horsepower (columns). min= 46, max=230, by=40 (No need to copy and paste the table to the homework. But you need it for the next step.) . Prepare a 100% Stacked Bar Chart of Origin of car (horizontal axis category) and horsepower (stacked categories). (Copy and Paste it here.) . Which origin of car has the highest engine horsepower?7. Weight and engine horsepower of car. . Do a Scatter Plot of weight (vertical axis) and horsepower(horizontal axis). Add a linear trend line. Copy and Paste it here. . Calculate the correlation between the weight and horsepower of car? . Comment on the relationship. Is it positive or negative? Strong or weak? Do heavier cars also have higher engine horsepower? 8. Draw a histogram for acceleration using a PivotTable. Group Settings: min= 0, max=26, by=2. . Comment on the shape of the histogram. Is it symmetric or skewed left/right?9. Suppose we have a sample space: S = {E, ,E, ,E. E, ,E. .E, E,), with probabilities: P(E ) = 0.05, P(E,) = 0.20, P(E.) = 0.20, P(E ) = 0.25. P(E,) = 0.15, P(E ) = 0.10, and P(E.) = 0.05. Consider the following events with their corresponding set of sample points: A = {E, E,,E ), B = (E, E E }, and C = (E,,E,}. Note: . P(A U B) = P(A) + P(B) - P(An B) . P(A V B) = P(A) + P(B) if A and B are mutually exclusive . P(An B) = o if A and B are mutually exclusive . P(A ) = 1 -P(A) P(AnB) P(A | B) = P(B) . P(A | B) = P(A) if A and B are independent a. Find the probabilities: P(A), P(B) and P(C]. b. Find the set of sample points of events AUB (this is a list of sample points {..}) and find P(AUB) ? c. Find the set of sample points of An B and find P(A n B). d. Now use the formula P(A U B) = P(A) + P(B) - P(A n B) to confirm your answer from part (b).e. Are events A and C mutually exclusive? f. Find B and P(BS) g. Calculate P(A | B) and P(B | A). Are they the same? h. Are events A and B independent?1o. Tammy is a general contractor and has submitted tivo bids for two projects {A and B}. The probability of getting project A is 0.65. The probability of getting project B is 0.77. The probability of getting at least one of the projects is o.9o. a. What is the probability that she will get both projects? In other words, P(AnB)? 13, Are the events of getting the two projects mutually exclusive? Explain, using probabilities. Q Are the two events independent? Explain, using probabilities. 11-Assume you are taking two courses this semester (A and B). The probability that you will pass course A is Pm) = 0,335, the probability that you will pass both courses is Puma) = o.276. The probability that you will pass at least one of the courses is PM U B] = 0.981. a. What is the probability that you will pass course B? (Hint: use the addition law to nd PfBJJ b. Is the passing of the two courses independent events? Use probability information to justify your answer. Q, Are the events of passing the courses mutually exclusive? Explain Assume you have applied to two different universities (let's refer to them as Universities A and B) for your graduate work. In the past, 25% of students (with similar credentials as yours] who applied to University A were accepted, while University B accepted 35% of the applicants. Assume events are independent of each other. a. What is the probability that you will be accepted to both universities? b. What is the probability that you will be accepted to at least one graduate program? .3, What is the probability that one and only one of the universities will accept you? d. What is the probability that neither university will accept you