Answered step by step
Verified Expert Solution
Question
1 Approved Answer
I would love some help on this MATLAB code for part 1. Suppose you are interviewing for an engineering position with FitBit. During the interview
I would love some help on this MATLAB code for part 1.
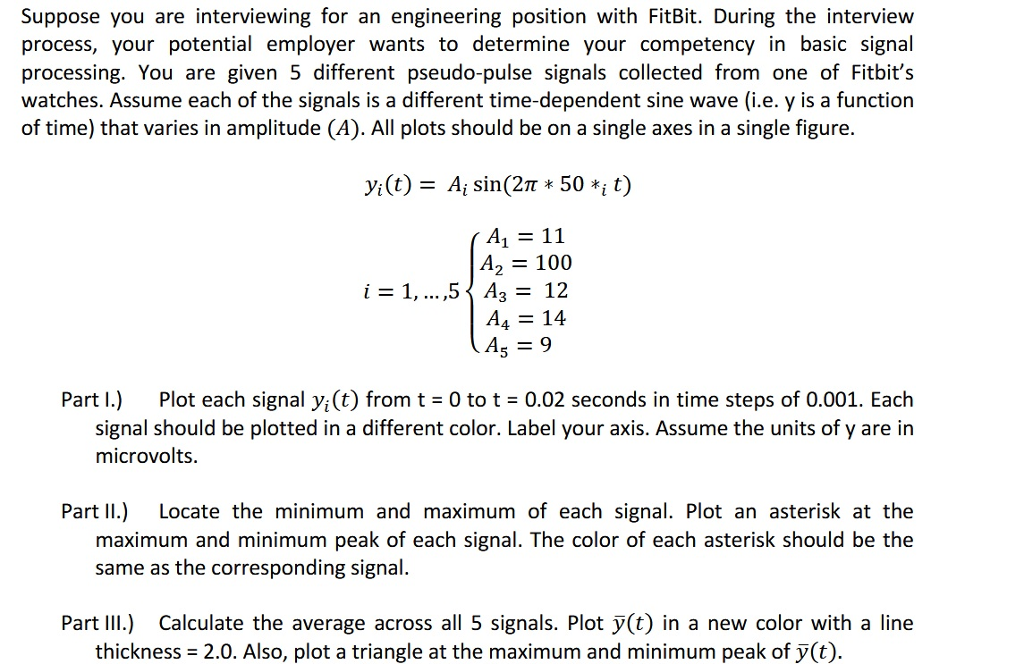
Suppose you are interviewing for an engineering position with FitBit. During the interview process, your potential employer wants to determine your competency in basic signal processing. You are given 5 different pseudo-pulse signals collected from one of Fitbit's watches. Assume each of the signals is a different time-dependent sine wave (i.e. y is a function of time) that varies in amplitude (A). All plots should be on a single axes in a single figure. yi(t) = Ai sin(2n * 50% ) A, = 11 A2 - 100 1-1, ,5 Ag = 12 A4 14 Part I.) Plot each signal y(t) from t = 0 to t = 0.02 seconds in time steps of 0.001. Each signal should be plotted in a different color. Label your axis. Assume the units of y are in microvolts. Part II.) Locate the minimum and maximum of each signal. Plot an asterisk at the maximum and minimum peak of each signal. The color of each asterisk should be the same as the corresponding signal Part II) Calculate the average across all 5 signals. Plot (t) in a new color with a line thickness 2.0. Also, plot a triangle at the maximum and minimum peak of y(t)Step by Step Solution
There are 3 Steps involved in it
Step: 1
Get Instant Access to Expert-Tailored Solutions
See step-by-step solutions with expert insights and AI powered tools for academic success
Step: 2
Step: 3
Ace Your Homework with AI
Get the answers you need in no time with our AI-driven, step-by-step assistance
Get Started