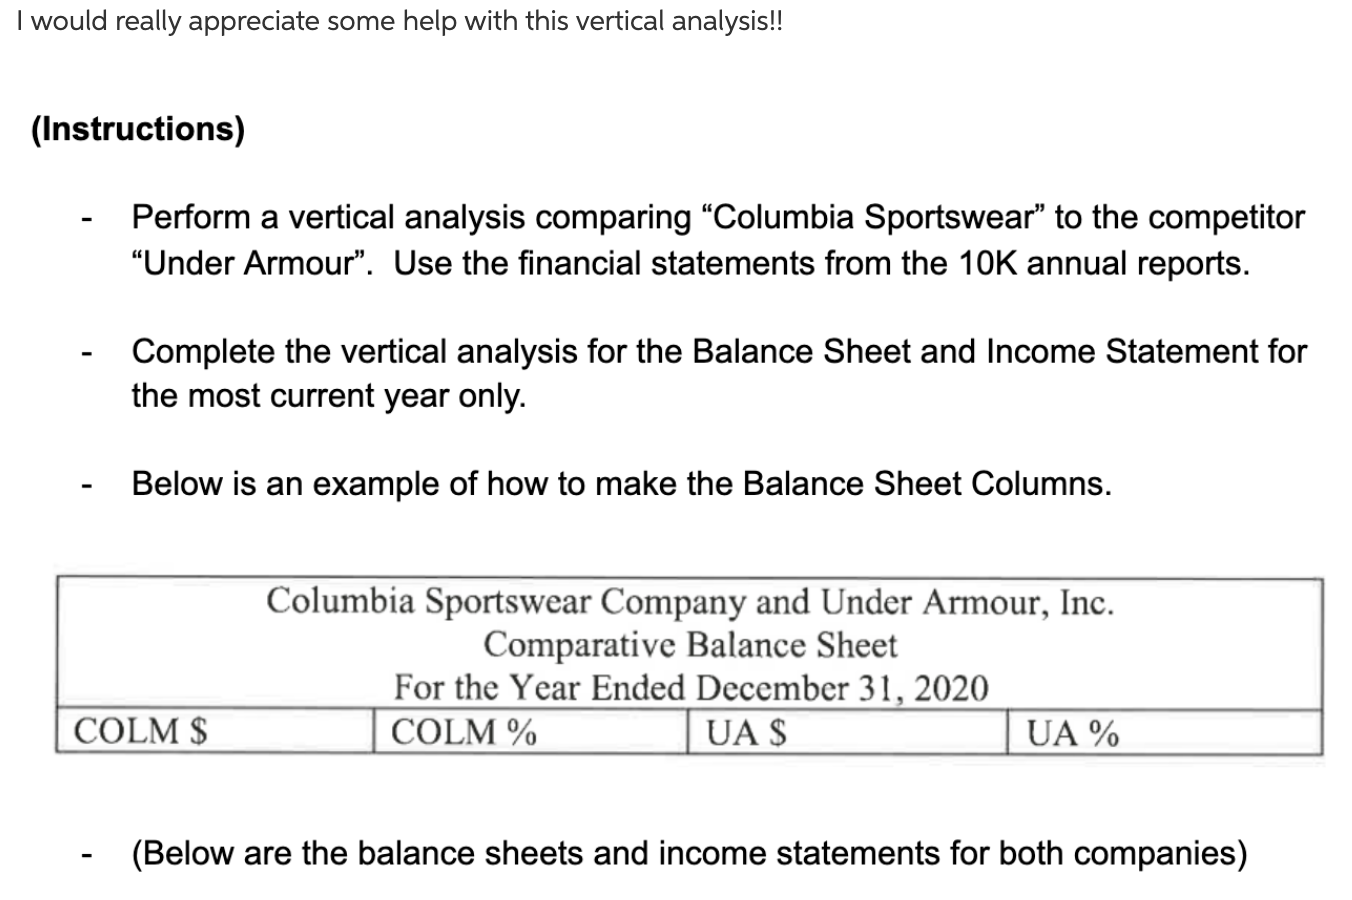
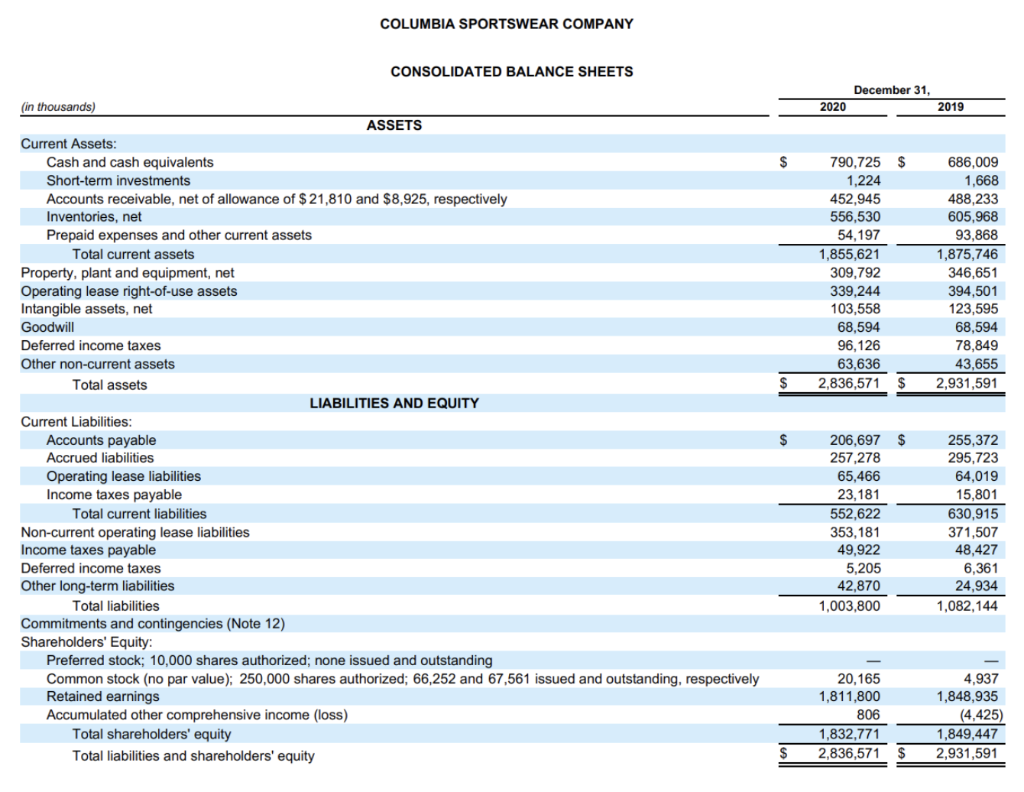

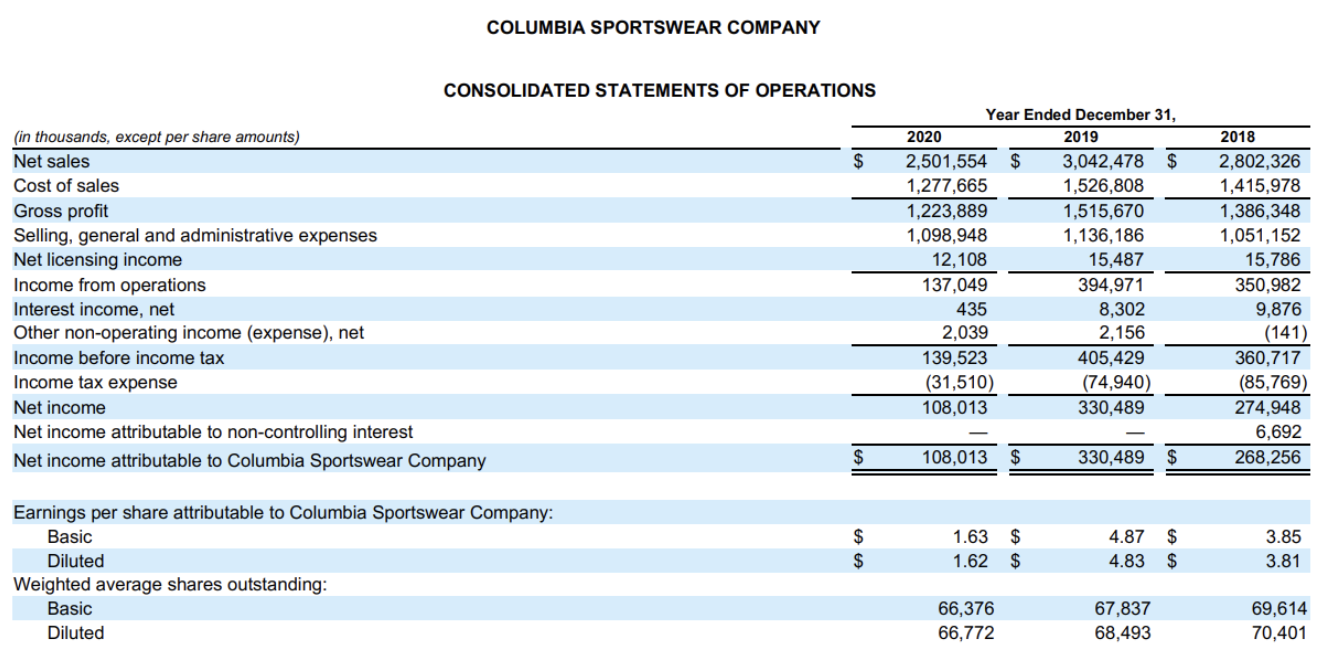
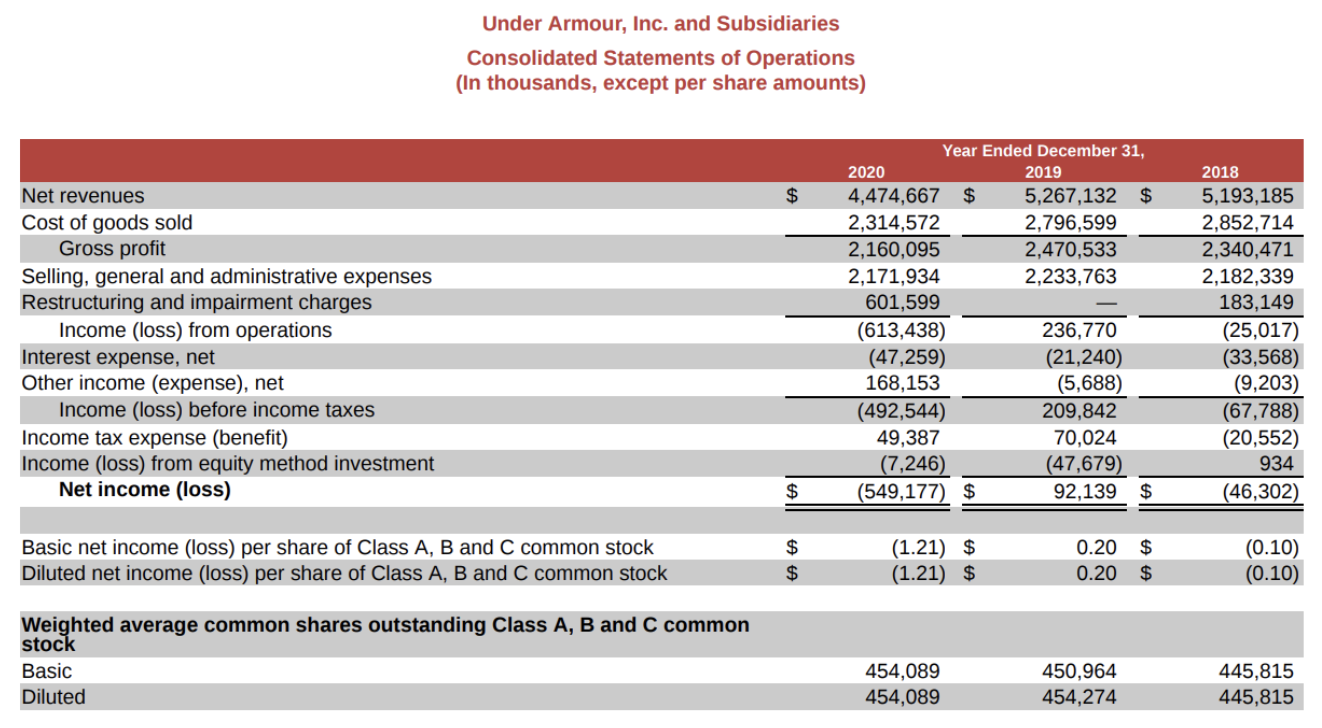
I would really appreciate some help with this vertical analysis!! (Instructions) Perform a vertical analysis comparing Columbia Sportswear to the competitor Under Armour. Use the financial statements from the 10K annual reports. Complete the vertical analysis for the Balance Sheet and Income Statement for the most current year only. Below is an example of how to make the Balance Sheet Columns. Columbia Sportswear Company and Under Armour, Inc. Comparative Balance Sheet For the Year Ended December 31, 2020 COLM % UAS UA % COLM $ (Below are the balance sheets and income statements for both companies) COLUMBIA SPORTSWEAR COMPANY CONSOLIDATED BALANCE SHEETS December 31, 2019 2020 $ 790,725 $ 1,224 452,945 556,530 54,197 1,855,621 309,792 339.244 103,558 68,594 96,126 63,636 2,836,571 $ 686,009 1,668 488,233 605,968 93,868 1,875,746 346,651 394,501 123,595 68,594 78,849 43,655 2,931,591 $ (in thousands) ASSETS Current Assets: Cash and cash equivalents Short-term investments Accounts receivable, net of allowance of $ 21,810 and $8,925, respectively Inventories, net Prepaid expenses and other current assets Total current assets Property, plant and equipment, net Operating lease right-of-use assets Intangible assets, net Goodwill Deferred income taxes Other non-current assets Total assets LIABILITIES AND EQUITY Current Liabilities: Accounts payable Accrued liabilities Operating lease liabilities Income taxes payable Total current liabilities Non-current operating lease liabilities Income taxes payable Deferred income taxes Other long-term liabilities Total liabilities Commitments and contingencies (Note 12) Shareholders' Equity: Preferred stock; 10,000 shares authorized; none issued and outstanding Common stock (no par value); 250,000 shares authorized; 66,252 and 67,561 issued and outstanding, respectively Retained earnings Accumulated other comprehensive income (loss) Total shareholders' equity Total liabilities and shareholders' equity $ 206,697 $ 257,278 65,466 23,181 552,622 353,181 49,922 5,205 42.870 1,003,800 255,372 295,723 64,019 15,801 630,915 371,507 48,427 6,361 24.934 1,082,144 20,165 1,811,800 806 1,832,771 2,836,571 4,937 1,848,935 (4,425) 1,849,447 2,931,591 Under Armour, Inc. and Subsidiaries Consolidated Balance Sheets (In thousands, except share data) 708,714 December 31, 2020 December 31, 2019 Assets Current assets Cash and cash equivalents $ 1,517,361 $ 788,072 Accounts receivable, net 527,340 Inventories 895,974 892,258 Prepaid expenses and other current assets 282,300 313,165 Total current assets 3,222,975 2,702,209 Property and equipment, net 658,678 792,148 Operating lease right-of-use assets 536,660 591,931 Goodwill 502,214 550,178 Intangible assets, net 13,295 36,345 Deferred income taxes 23,930 82,379 Other long-term assets 72,876 88,341 Total assets $ 5,030,628 4,843,531 Liabilities and Stockholders' Equity Current liabilities Accounts payable $ 575,954 $ 618,194 Accrued expenses 378,859 374,694 Customer refund liabilities 203,399 219,424 Operating lease liabilities 162,561 125,900 Other current liabilities 92,503 83,797 Total current liabilities 1,413,276 1,422,009 Long term debt 1,003,556 592,687 Operating lease liabilities, non-current 839,414 580,635 Other long-term liabilities 98,389 98,113 Total liabilities 3,354,635 2,693,444 Commitments and contingencies (see Note 10) Stockholders' equity Class A Common Stock, $0.0003 1/3 par value; 400,000,000 shares authorized as of December 31, 2020 and 2019; 188,603,686 shares issued and outstanding as of December 31, 2020 62 62 (2019: 188,289,680) Class B Convertible Common Stock, $0.0003 1/3 par value; 34,450,000 shares authorized, 11 11 issued and outstanding as of December 31, 2020 and 2019. Class C Common Stock, $0.0003 1/3 par value; 400,000,000 shares authorized as of December 31, 2020 and 2019; 231,953,667 shares issued and outstanding as of December 31, 2020 77 76 (2019: 229,027,730) Additional paid-in capital 1,061,173 973,717 Retained earnings 673,855 1,226,986 Accumulated other comprehensive loss (59,185) (50,765) Total stockholders' equity 1,675,993 2,150,087 Total liabilities and stockholders' equity $ 5,030,628 $ 4,843,531 COLUMBIA SPORTSWEAR COMPANY CONSOLIDATED STATEMENTS OF OPERATIONS $ (in thousands, except per share amounts) Net sales Cost of sales Gross profit Selling, general and administrative expenses Net licensing income Income from operations Interest income, net Other non-operating income (expense), net Income before income tax Income tax expense Net income Net income attributable to non-controlling interest Net income attributable to Columbia Sportswear Company Year Ended December 31, 2020 2019 2,501,554 $ 3,042,478 1,277,665 1,526,808 1,223,889 1,515,670 1,098,948 1,136,186 12, 108 15,487 137,049 394,971 435 8,302 2,039 2,156 139,523 405,429 (31,510) (74,940) 108,013 330,489 2018 2,802,326 1,415,978 1,386,348 1,051, 152 15,786 350,982 9,876 (141) 360,717 (85,769) 274,948 6,692 268,256 $ 108,013 330,489 $ 1.63 1.62 $ $ 4.87 $ 4.83 $ 3.85 3.81 Earnings per share attributable to Columbia Sportswear Company: Basic Diluted Weighted average shares outstanding: Basic Diluted $ 66,376 66,772 67,837 68,493 69,614 70,401 Under Armour, Inc. and Subsidiaries Consolidated Statements of Operations (In thousands, except per share amounts) $ Net revenues Cost of goods sold Gross profit Selling, general and administrative expenses Restructuring and impairment charges Income (loss) from operations Interest expense, net Other income (expense), net Income (loss) before income taxes Income tax expense (benefit) Income (loss) from equity method investment Net income (loss) Year Ended December 31, 2020 2019 4,474,667 $ 5,267,132 $ 2,314,572 2,796,599 2,160,095 2,470,533 2,171,934 2,233,763 601,599 (613,438) 236,770 (47,259) (21,240) 168,153 (5,688) (492,544) 209,842 49,387 70,024 (7,246) (47,679) (549,177) $ 92,139 $ 2018 5,193,185 2,852,714 2,340,471 2,182,339 183,149 (25,017) (33,568) (9,203) (67,788) (20,552) 93 (46,302) $ Basic net income (loss) per share of Class A, B and C common stock Diluted net income (loss) per share of Class A, B and C common stock $ $ (1.21) $ (1.21) $ 0.20 $ 0.20 $ (0.10) (0.10) Weighted average common shares outstanding Class A, B and C common stock Basic Diluted 454,089 454,089 450,964 454,274 445,815 445,815 I would really appreciate some help with this vertical analysis!! (Instructions) Perform a vertical analysis comparing Columbia Sportswear to the competitor Under Armour. Use the financial statements from the 10K annual reports. Complete the vertical analysis for the Balance Sheet and Income Statement for the most current year only. Below is an example of how to make the Balance Sheet Columns. Columbia Sportswear Company and Under Armour, Inc. Comparative Balance Sheet For the Year Ended December 31, 2020 COLM % UAS UA % COLM $ (Below are the balance sheets and income statements for both companies) COLUMBIA SPORTSWEAR COMPANY CONSOLIDATED BALANCE SHEETS December 31, 2019 2020 $ 790,725 $ 1,224 452,945 556,530 54,197 1,855,621 309,792 339.244 103,558 68,594 96,126 63,636 2,836,571 $ 686,009 1,668 488,233 605,968 93,868 1,875,746 346,651 394,501 123,595 68,594 78,849 43,655 2,931,591 $ (in thousands) ASSETS Current Assets: Cash and cash equivalents Short-term investments Accounts receivable, net of allowance of $ 21,810 and $8,925, respectively Inventories, net Prepaid expenses and other current assets Total current assets Property, plant and equipment, net Operating lease right-of-use assets Intangible assets, net Goodwill Deferred income taxes Other non-current assets Total assets LIABILITIES AND EQUITY Current Liabilities: Accounts payable Accrued liabilities Operating lease liabilities Income taxes payable Total current liabilities Non-current operating lease liabilities Income taxes payable Deferred income taxes Other long-term liabilities Total liabilities Commitments and contingencies (Note 12) Shareholders' Equity: Preferred stock; 10,000 shares authorized; none issued and outstanding Common stock (no par value); 250,000 shares authorized; 66,252 and 67,561 issued and outstanding, respectively Retained earnings Accumulated other comprehensive income (loss) Total shareholders' equity Total liabilities and shareholders' equity $ 206,697 $ 257,278 65,466 23,181 552,622 353,181 49,922 5,205 42.870 1,003,800 255,372 295,723 64,019 15,801 630,915 371,507 48,427 6,361 24.934 1,082,144 20,165 1,811,800 806 1,832,771 2,836,571 4,937 1,848,935 (4,425) 1,849,447 2,931,591 Under Armour, Inc. and Subsidiaries Consolidated Balance Sheets (In thousands, except share data) 708,714 December 31, 2020 December 31, 2019 Assets Current assets Cash and cash equivalents $ 1,517,361 $ 788,072 Accounts receivable, net 527,340 Inventories 895,974 892,258 Prepaid expenses and other current assets 282,300 313,165 Total current assets 3,222,975 2,702,209 Property and equipment, net 658,678 792,148 Operating lease right-of-use assets 536,660 591,931 Goodwill 502,214 550,178 Intangible assets, net 13,295 36,345 Deferred income taxes 23,930 82,379 Other long-term assets 72,876 88,341 Total assets $ 5,030,628 4,843,531 Liabilities and Stockholders' Equity Current liabilities Accounts payable $ 575,954 $ 618,194 Accrued expenses 378,859 374,694 Customer refund liabilities 203,399 219,424 Operating lease liabilities 162,561 125,900 Other current liabilities 92,503 83,797 Total current liabilities 1,413,276 1,422,009 Long term debt 1,003,556 592,687 Operating lease liabilities, non-current 839,414 580,635 Other long-term liabilities 98,389 98,113 Total liabilities 3,354,635 2,693,444 Commitments and contingencies (see Note 10) Stockholders' equity Class A Common Stock, $0.0003 1/3 par value; 400,000,000 shares authorized as of December 31, 2020 and 2019; 188,603,686 shares issued and outstanding as of December 31, 2020 62 62 (2019: 188,289,680) Class B Convertible Common Stock, $0.0003 1/3 par value; 34,450,000 shares authorized, 11 11 issued and outstanding as of December 31, 2020 and 2019. Class C Common Stock, $0.0003 1/3 par value; 400,000,000 shares authorized as of December 31, 2020 and 2019; 231,953,667 shares issued and outstanding as of December 31, 2020 77 76 (2019: 229,027,730) Additional paid-in capital 1,061,173 973,717 Retained earnings 673,855 1,226,986 Accumulated other comprehensive loss (59,185) (50,765) Total stockholders' equity 1,675,993 2,150,087 Total liabilities and stockholders' equity $ 5,030,628 $ 4,843,531 COLUMBIA SPORTSWEAR COMPANY CONSOLIDATED STATEMENTS OF OPERATIONS $ (in thousands, except per share amounts) Net sales Cost of sales Gross profit Selling, general and administrative expenses Net licensing income Income from operations Interest income, net Other non-operating income (expense), net Income before income tax Income tax expense Net income Net income attributable to non-controlling interest Net income attributable to Columbia Sportswear Company Year Ended December 31, 2020 2019 2,501,554 $ 3,042,478 1,277,665 1,526,808 1,223,889 1,515,670 1,098,948 1,136,186 12, 108 15,487 137,049 394,971 435 8,302 2,039 2,156 139,523 405,429 (31,510) (74,940) 108,013 330,489 2018 2,802,326 1,415,978 1,386,348 1,051, 152 15,786 350,982 9,876 (141) 360,717 (85,769) 274,948 6,692 268,256 $ 108,013 330,489 $ 1.63 1.62 $ $ 4.87 $ 4.83 $ 3.85 3.81 Earnings per share attributable to Columbia Sportswear Company: Basic Diluted Weighted average shares outstanding: Basic Diluted $ 66,376 66,772 67,837 68,493 69,614 70,401 Under Armour, Inc. and Subsidiaries Consolidated Statements of Operations (In thousands, except per share amounts) $ Net revenues Cost of goods sold Gross profit Selling, general and administrative expenses Restructuring and impairment charges Income (loss) from operations Interest expense, net Other income (expense), net Income (loss) before income taxes Income tax expense (benefit) Income (loss) from equity method investment Net income (loss) Year Ended December 31, 2020 2019 4,474,667 $ 5,267,132 $ 2,314,572 2,796,599 2,160,095 2,470,533 2,171,934 2,233,763 601,599 (613,438) 236,770 (47,259) (21,240) 168,153 (5,688) (492,544) 209,842 49,387 70,024 (7,246) (47,679) (549,177) $ 92,139 $ 2018 5,193,185 2,852,714 2,340,471 2,182,339 183,149 (25,017) (33,568) (9,203) (67,788) (20,552) 93 (46,302) $ Basic net income (loss) per share of Class A, B and C common stock Diluted net income (loss) per share of Class A, B and C common stock $ $ (1.21) $ (1.21) $ 0.20 $ 0.20 $ (0.10) (0.10) Weighted average common shares outstanding Class A, B and C common stock Basic Diluted 454,089 454,089 450,964 454,274 445,815 445,815