 i=5%
i=5%

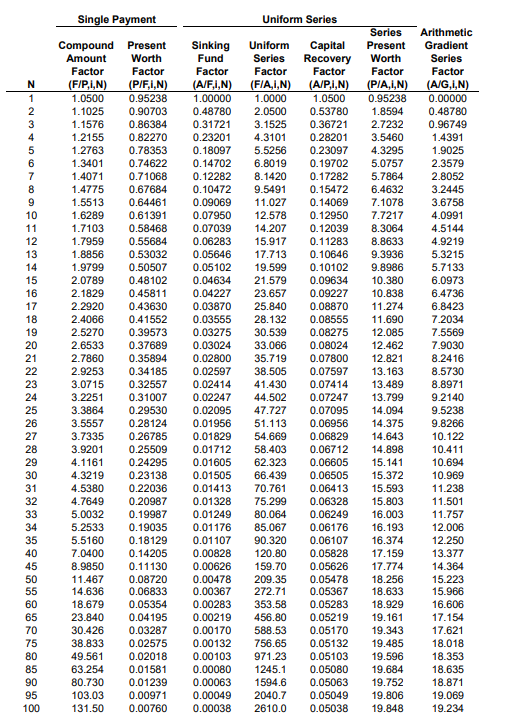
The following pair of assets differ only in the MARR. The problem asks you to determine the effect of this difference on the economic life and to explain the result. All assets decline in value by 20 percent of current value each year. Installation costs are zero for all assets. Further data concerning the four pairs of assets are given in the table that follows. Initial Operating Rate of Operating Asset First Cost Cost Cost Increase MARR A $130,000 $35,000 13.5%/year 5% B $130,000 $35,000 13.5%/year 25% a. Determine the economic lives for assets A and B. b. Create a diagram showing the EAC(capital), the EAC(operating), and the EAC(total) for assets A and B. c. Explain the difference in economic life between A and B. Single Payment Uniform Series N 1 2 3 4 5 6 7 8 9 10 11 12 13 14 15 16 17 18 19 20 21 22 23 24 25 26 27 28 29 30 31 32 33 34 35 40 45 50 55 60 65 70 75 80 85 90 95 100 Compound Present Amount Worth Factor Factor (F/P,1,N) (P/F,1,N) 1.0500 0.95238 1.1025 0.90703 1.1576 0.86384 1.2155 0.82270 1.2763 0.78353 1.3401 0.74622 1.4071 0.71068 1.4775 0.67684 1.5513 0.64461 1.6289 0.61391 1.7103 0.58468 1.7959 0.55684 1.8856 0.53032 1.9799 0.50507 2.0789 0.48102 2.1829 0.45811 2.2920 0.43630 2.4066 0.41552 2.5270 0.39573 2.6533 0.37689 2.7860 0.35894 2.9253 0.34185 3.0715 0.32557 3.2251 0.31007 3.3864 0.29530 3.5557 0.28124 3.7335 0.26785 3.9201 0.25509 4.1161 0.24295 4.3219 0.23138 4.5380 0.22036 4.7649 0.20987 5.0032 0.19987 5.2533 0.19035 5.5160 0.18129 7.0400 0.14205 8.9850 0.11130 11.467 0.08720 14.636 0.06833 18.679 0.05354 23.840 0.04195 30.426 0.03287 38.833 0.02575 49.561 0.02018 63.254 0.01581 80.730 0.01239 103.03 0.00971 131.50 0.00760 Sinking Uniform Capital Fund Series Recovery Factor Factor Factor (A/F,1,N) (F/A,1,N) (A/P,1,N) 1.00000 1.0000 1.0500 0.48780 2.0500 0.53780 0.31721 3.1525 0.36721 0.23201 4.3101 0.28201 0.18097 5.5256 0.23097 0.14702 6.8019 0.19702 0.12282 8.1420 0.17282 0.10472 9.5491 0.15472 0.09069 11.027 0.14069 0.07950 12.578 0.12950 0.07039 14.207 0.12039 0.06283 15.917 0.11283 0.05646 17.713 0.10646 0.05102 19.599 0.10102 0.04634 21.579 0.09634 0.04227 23.657 0.09227 0.03870 25.840 0.08870 0.03555 28.132 0.08555 0.03275 30.539 0.08275 0.03024 33.066 0.08024 0.02800 35.719 0.07800 0.02597 38.505 0.07597 0.02414 41.430 0.07414 0.02247 44.502 0.07247 0.02095 47.727 0.07095 0.01956 51.113 0.06956 0.01829 54.669 0.06829 0.01712 58.403 0.06712 0.01605 62.323 0.06605 0.01505 66.439 0.06505 0.01413 70.761 0.06413 0.01328 75.299 0.06328 0.01249 80.064 0.06249 0.01176 85.067 0.06176 0.01107 90.320 0.06107 0.00828 120.80 0.05828 0.00626 159.70 0.05626 0.00478 209.35 0.05478 0.00367 272.71 0.05367 0.00283 353.58 0.05283 0.00219 456.80 0.05219 0.00170 588.53 0.05170 0.00132 756.65 0.05132 0.00103 971.23 0.05103 0.00080 1245.1 0.05080 0.00063 1594.6 0.05063 0.00049 2040.7 0.05049 0.00038 2610.0 0.05038 Series Present Worth Factor (PIA,1,N) 0.95238 1.8594 2.7232 3.5460 4.3295 5.0757 5.7864 6.4632 7.1078 7.7217 8.3064 8.8633 9.3936 9.8986 10.380 10.838 11.274 11.690 12.085 12.462 12.821 13.163 13.489 13.799 14.094 14.375 14.643 14.898 15.141 15.372 15.593 15.803 16.003 16.193 16.374 17.159 17.774 18.256 18.633 18.929 19.161 19.343 19. 19.596 19.684 19.752 19.806 19.848 Arithmetic Gradient Series Factor (A/G,1,N) 0.00000 0.48780 0.96749 1.4391 1.9025 2.3579 2.8052 3.2445 3.6758 4.0991 4.5144 4.9219 5.3215 5.7133 6.0973 6.4736 6.8423 7.2034 7.5569 7.9030 8.2416 8.5730 8.8971 9.2140 9.5238 9.8266 10.122 10.411 10.694 10.969 11.238 11.501 11.757 12.006 12.250 13.377 14.364 15.223 15.966 16.606 17.154 17.621 18.018 18.353 18.635 18.871 19.069 19.234
 i=5%
i=5%


