

Answered step by step
Verified Expert Solution
Question
1 Approved Answer
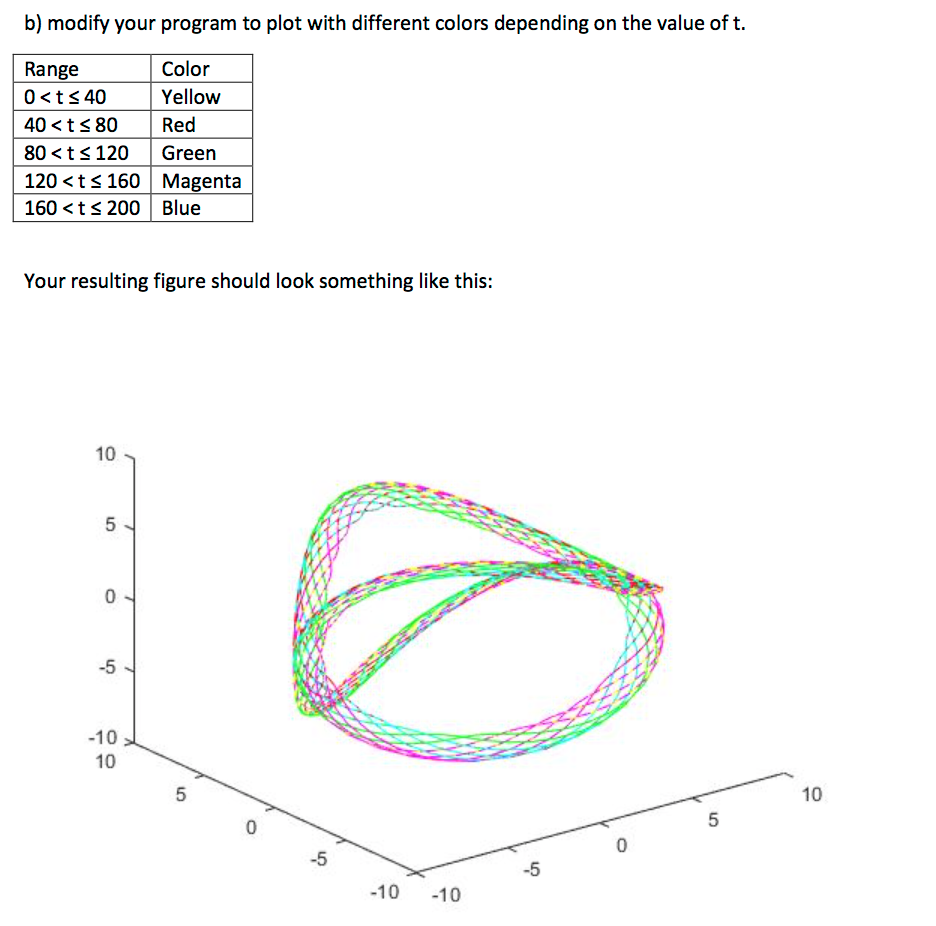
ICA 1: a) Using plot3, plot x, y and z given by the follow equations, for the range of t = 0 to 200 in

Step by Step Solution
There are 3 Steps involved in it
Step: 1

Get Instant Access to Expert-Tailored Solutions
See step-by-step solutions with expert insights and AI powered tools for academic success
Step: 2

Step: 3
Ace Your Homework with AI
Get the answers you need in no time with our AI-driven, step-by-step assistance
Get Started
Icdt 88 2nd International Conference On Database Theory Bruges Belgium August 31 September 2 1988 Proceedings Lncs 326
Authors: Marc Gyssens ,Jan Paredaens ,Dirk Van Gucht
1st Edition
3540501711, 978-3540501718