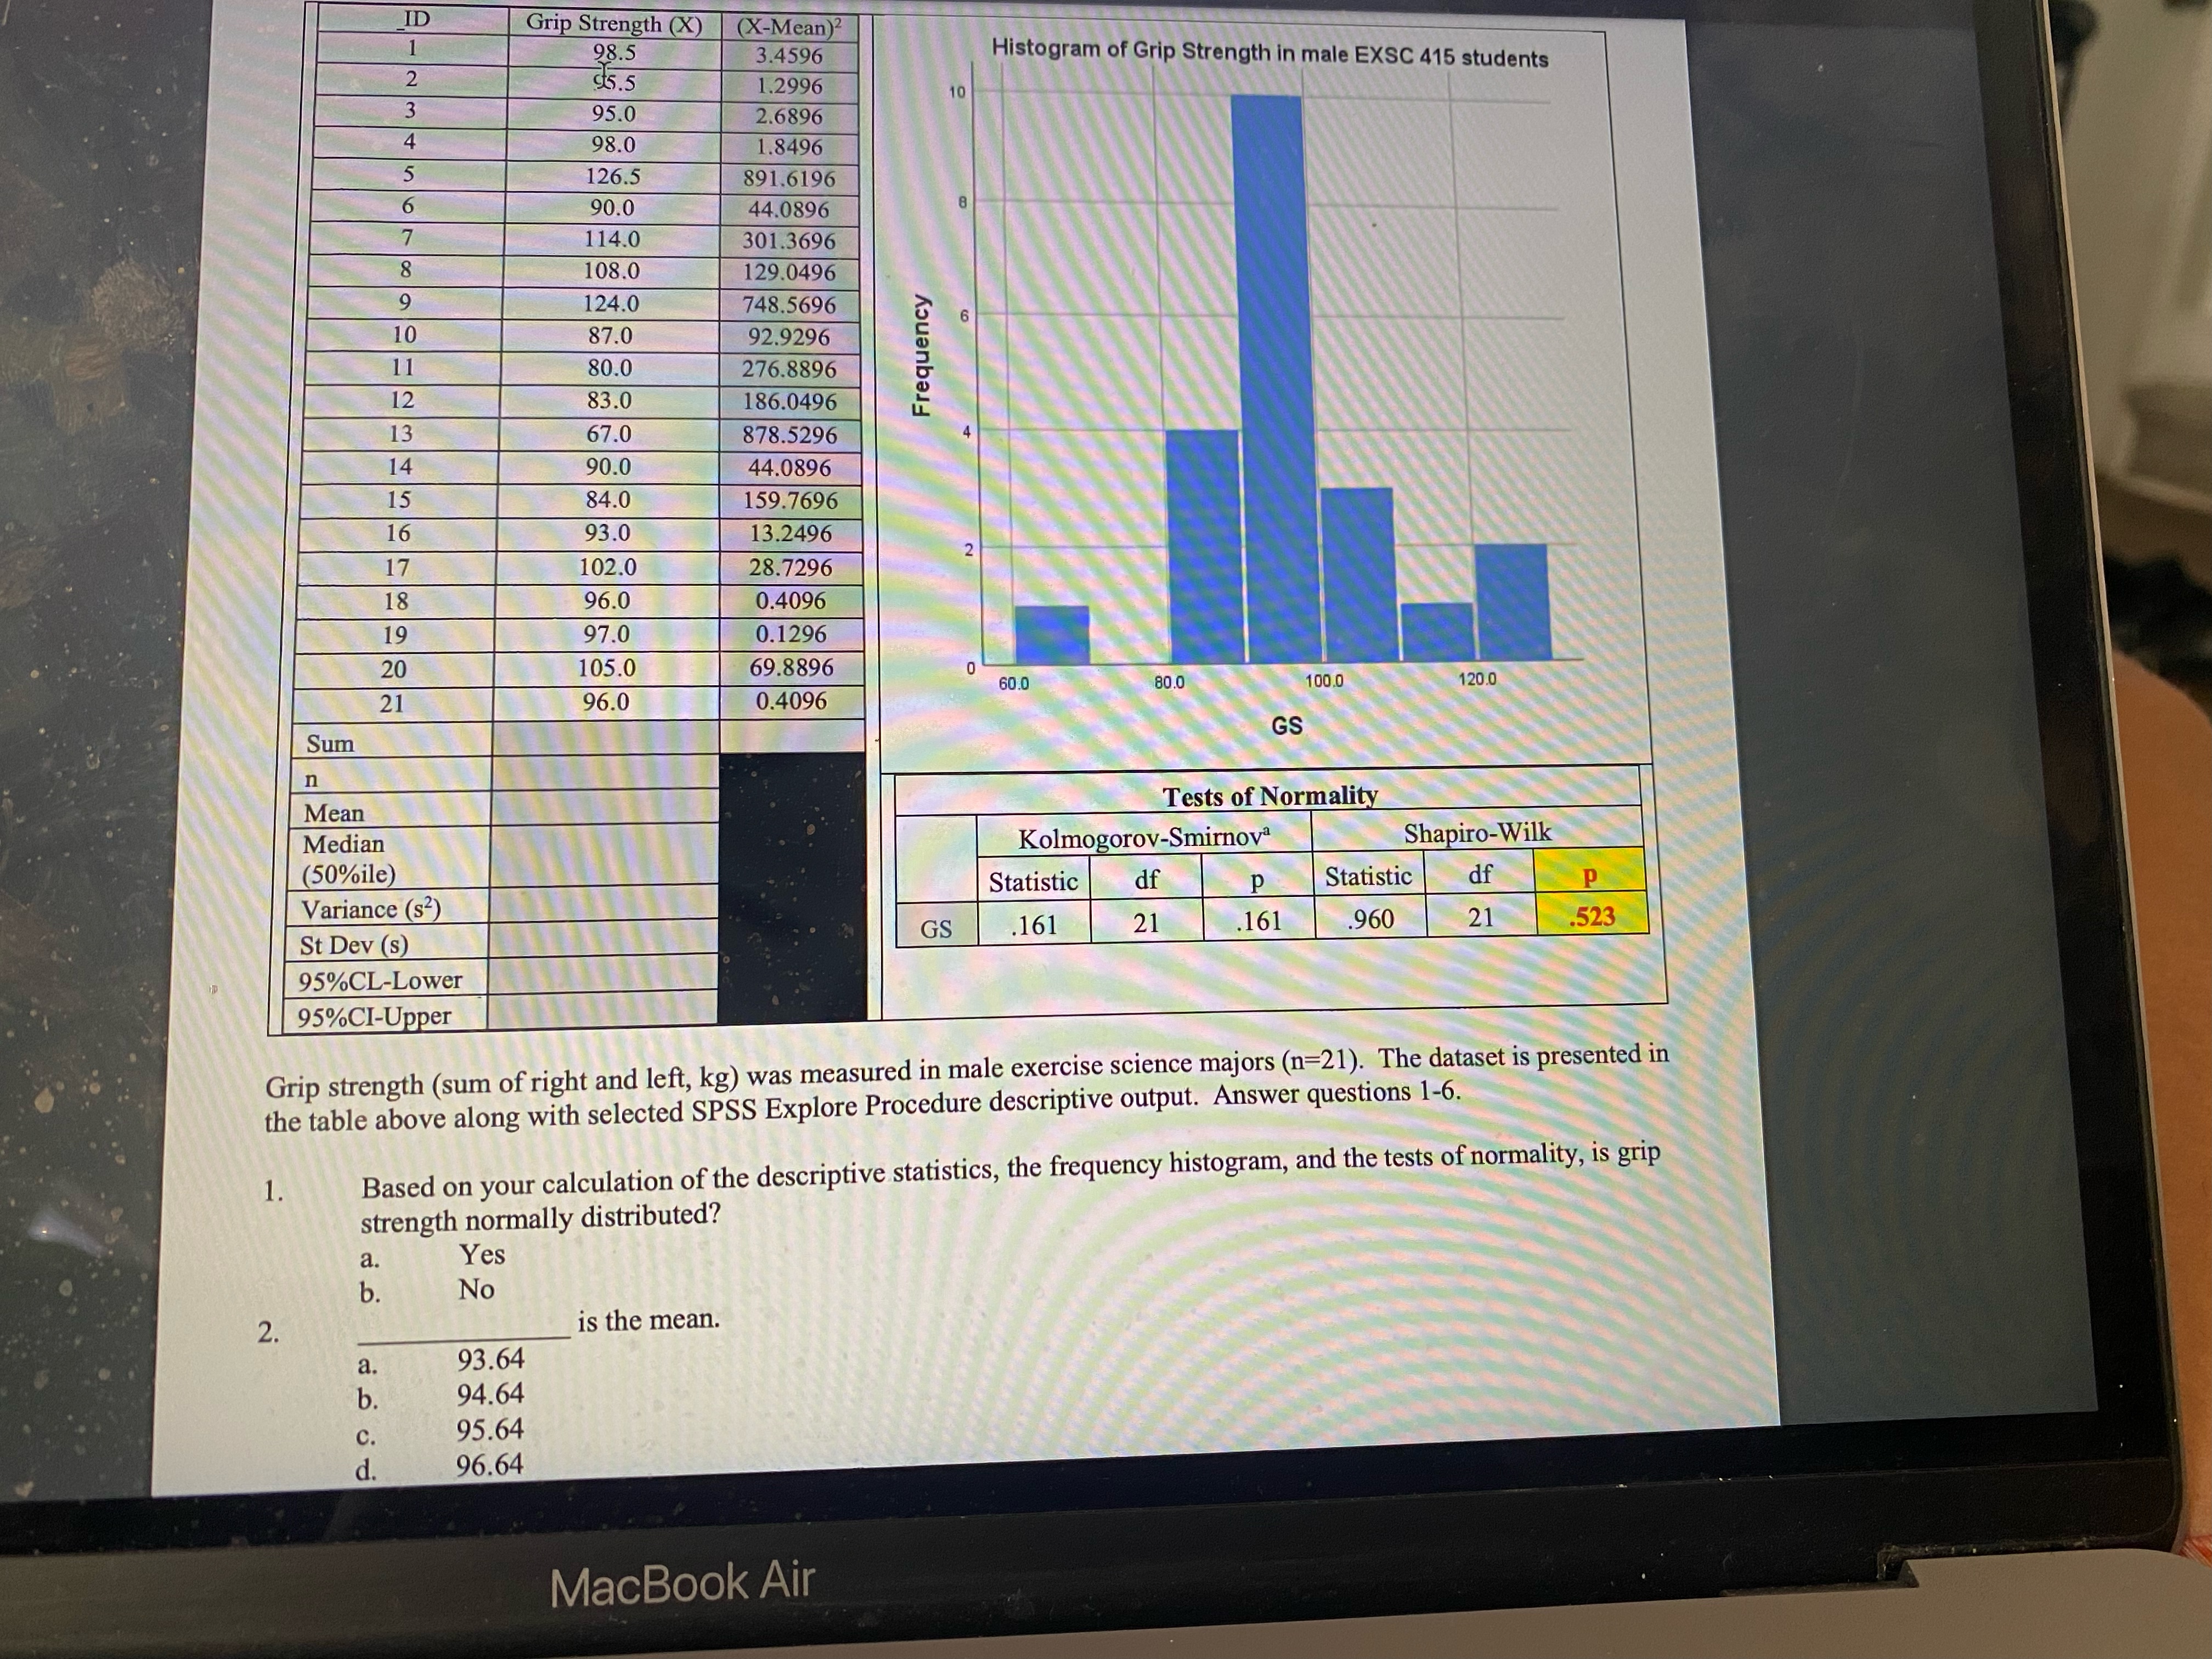
ID Grip Strength (X) (X-Mean)2 98.5 3.4596 Histogram of Grip Strength in male EXSC 415 students $5.5 1.2996 10 95.0 2.6896 98.0 1.8496 126.5 891.6196
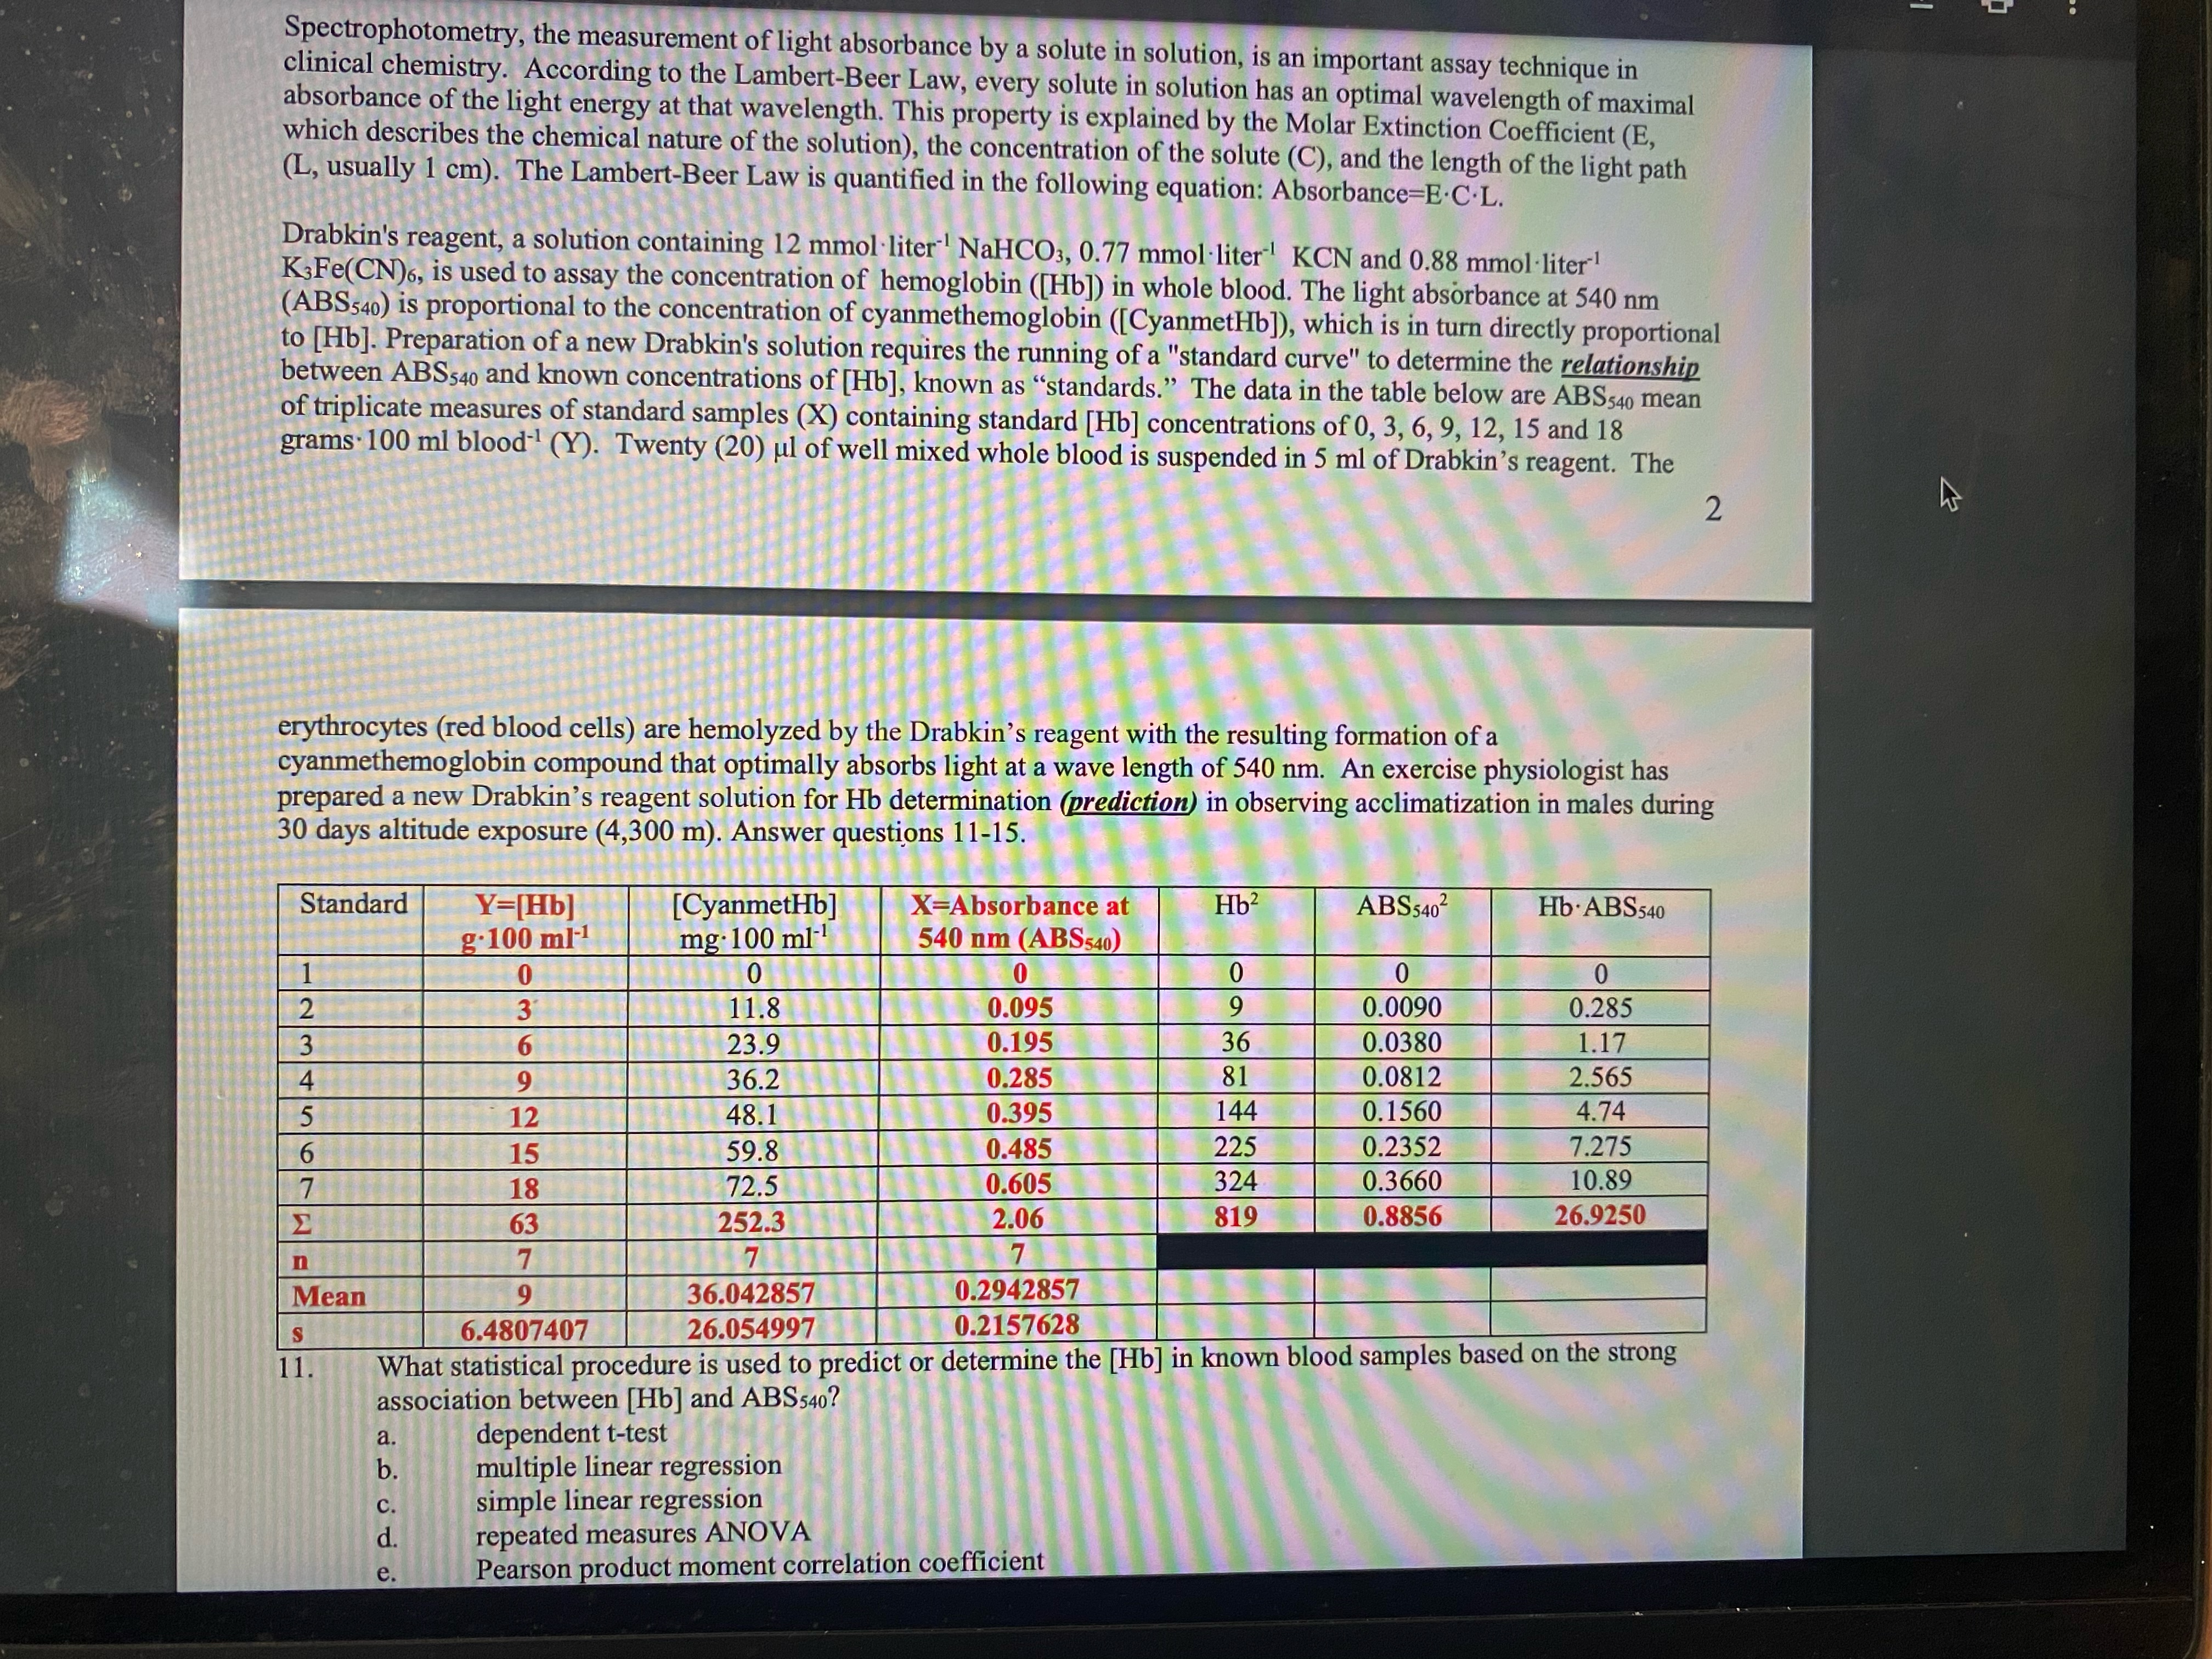
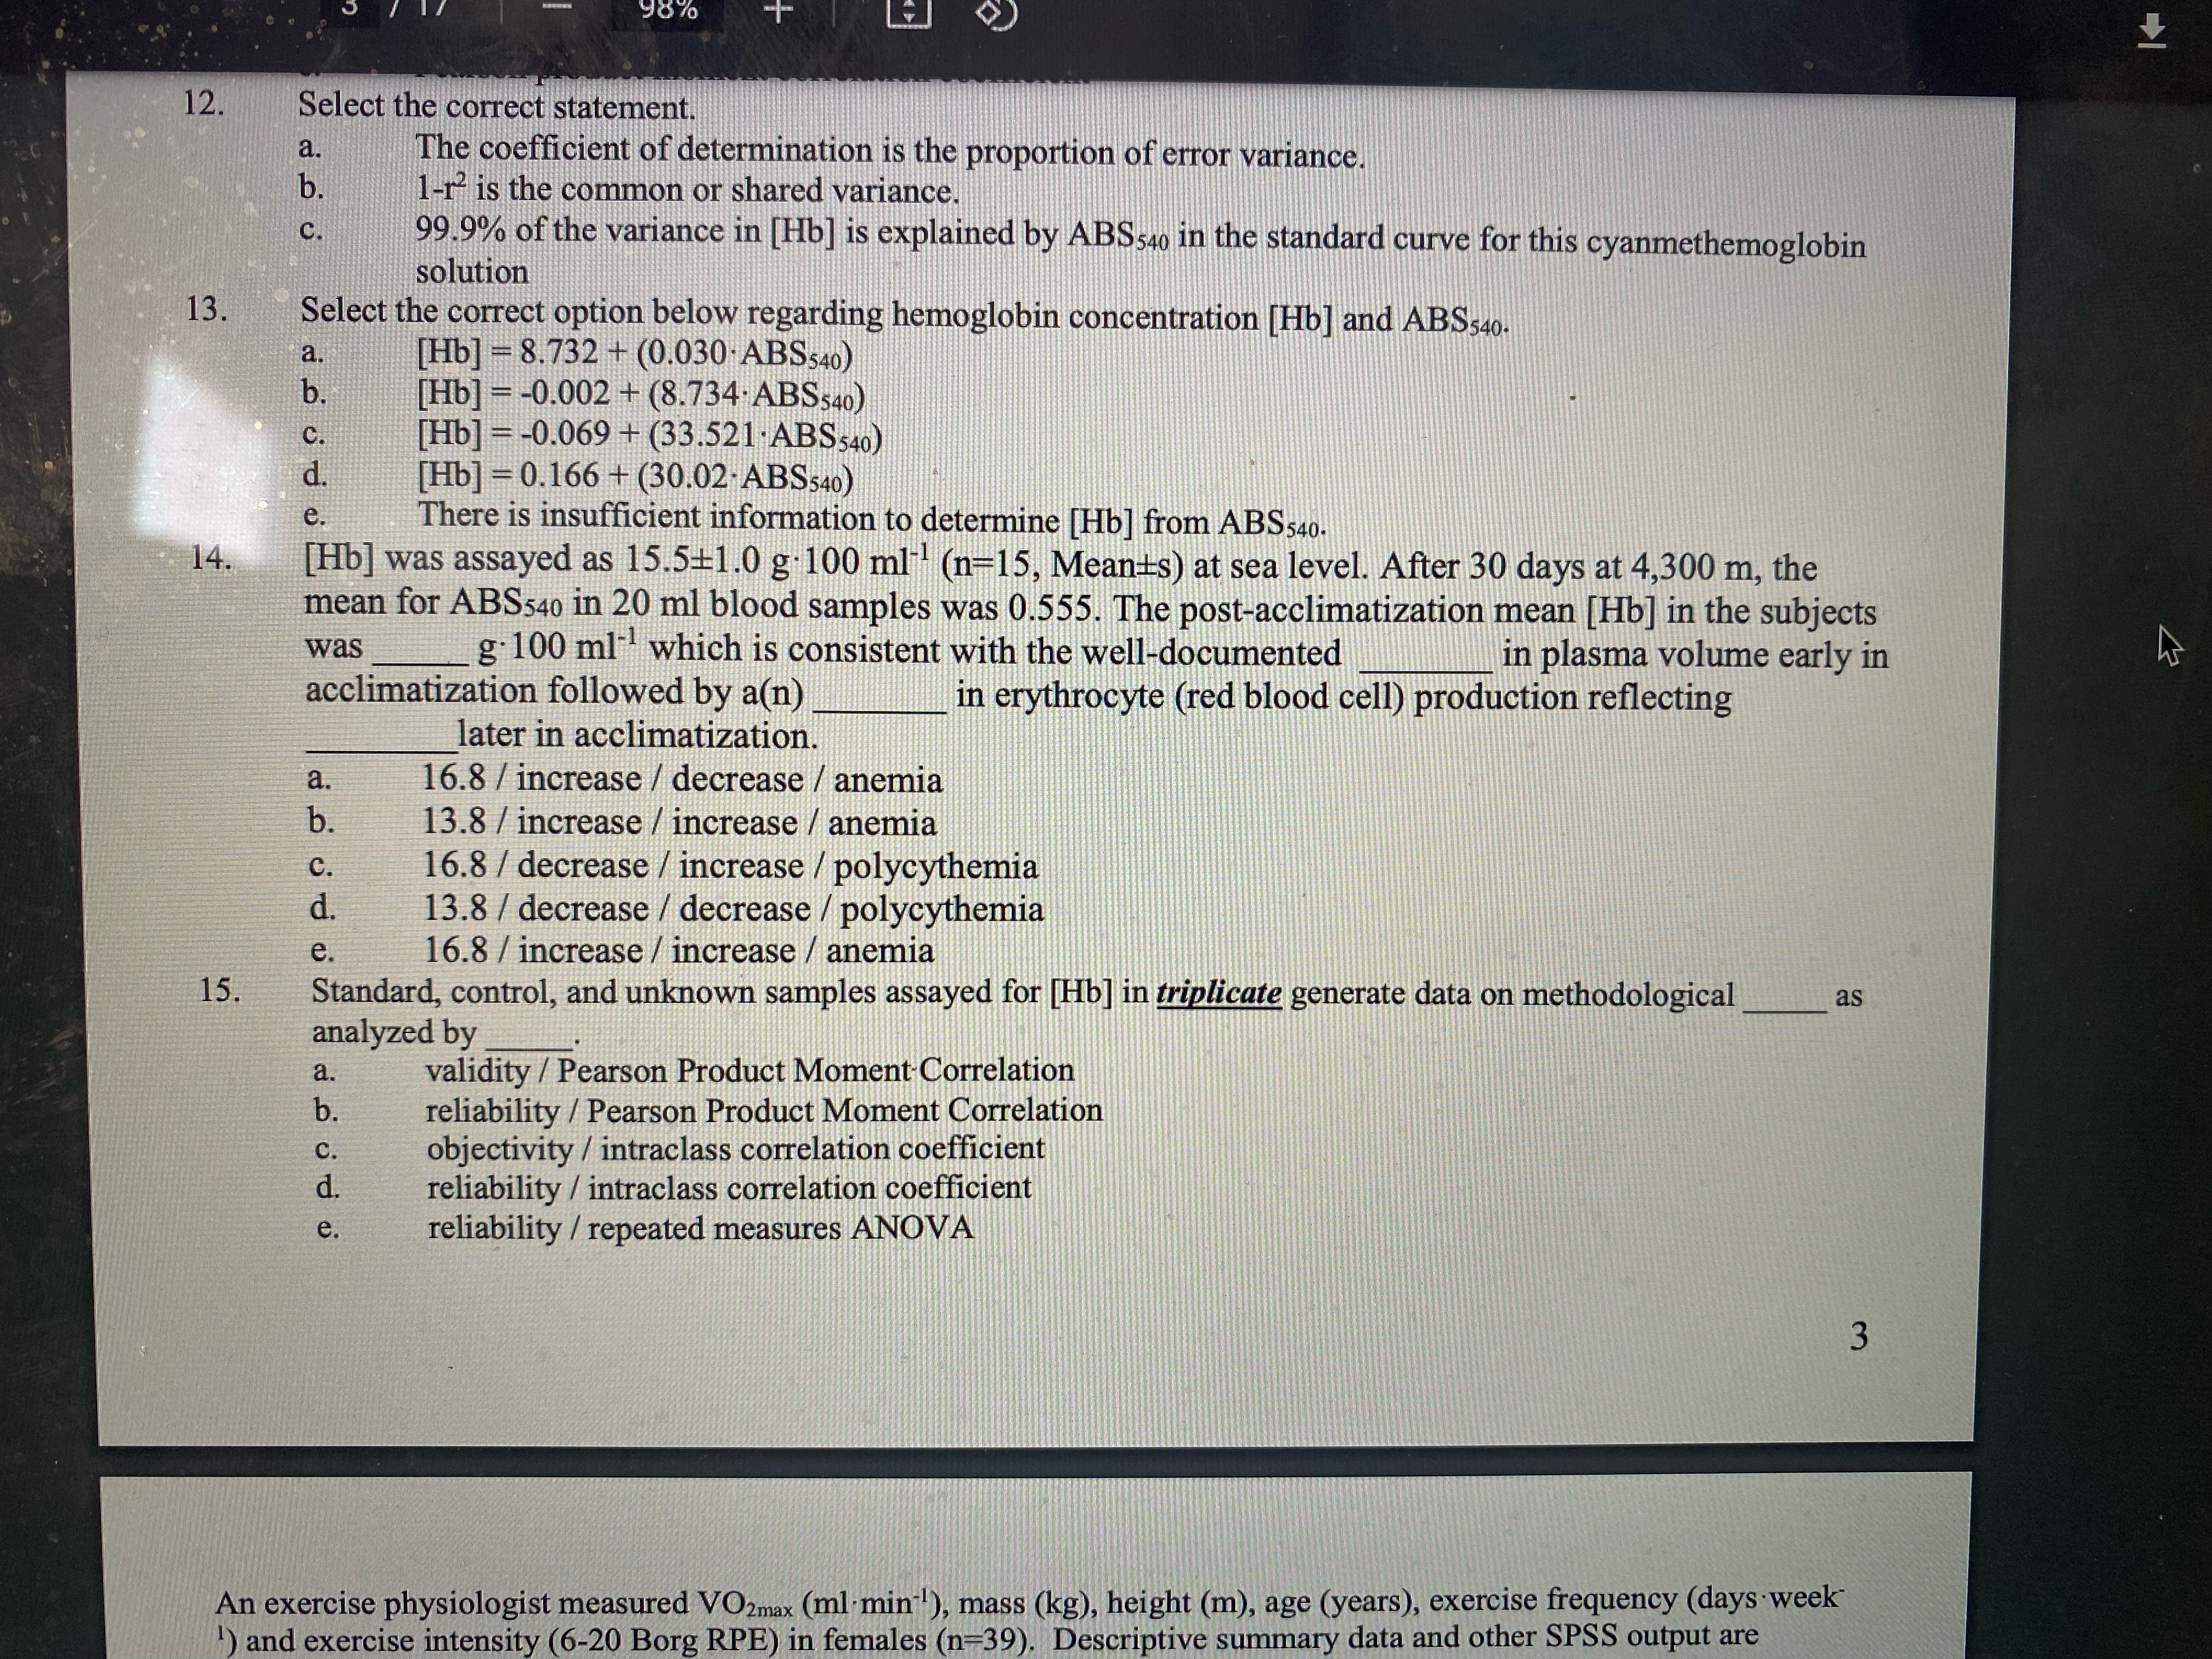
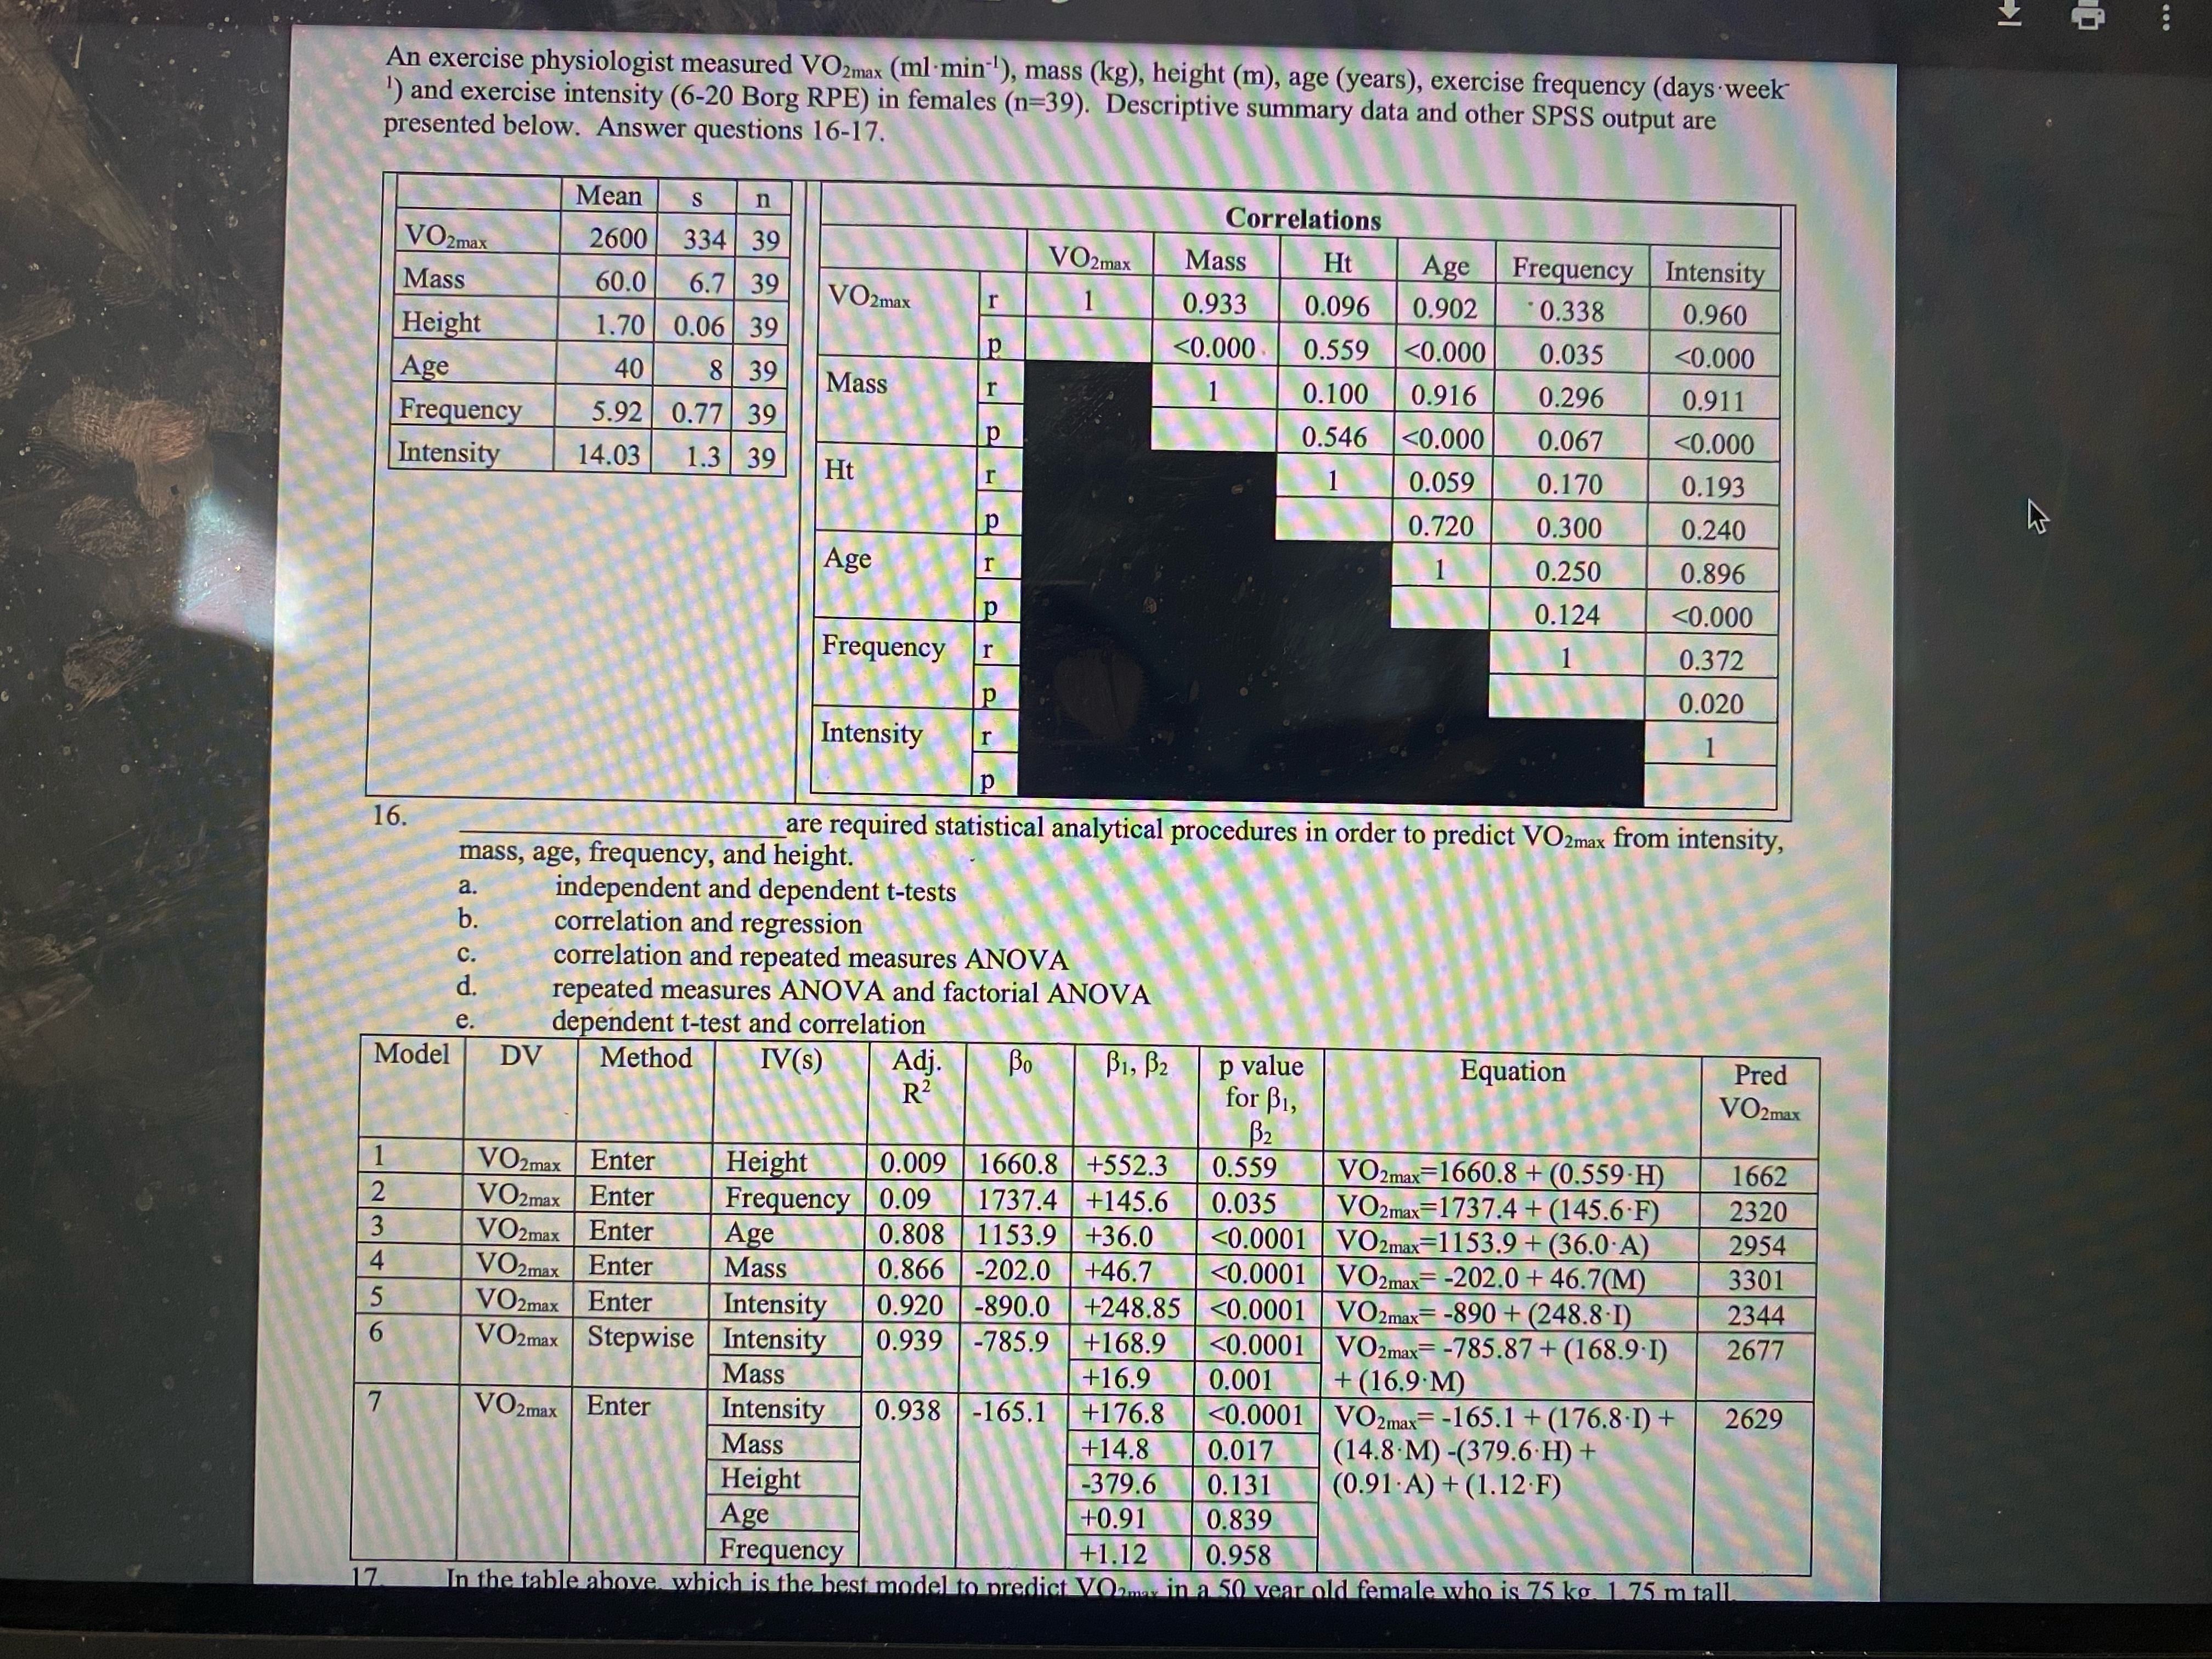
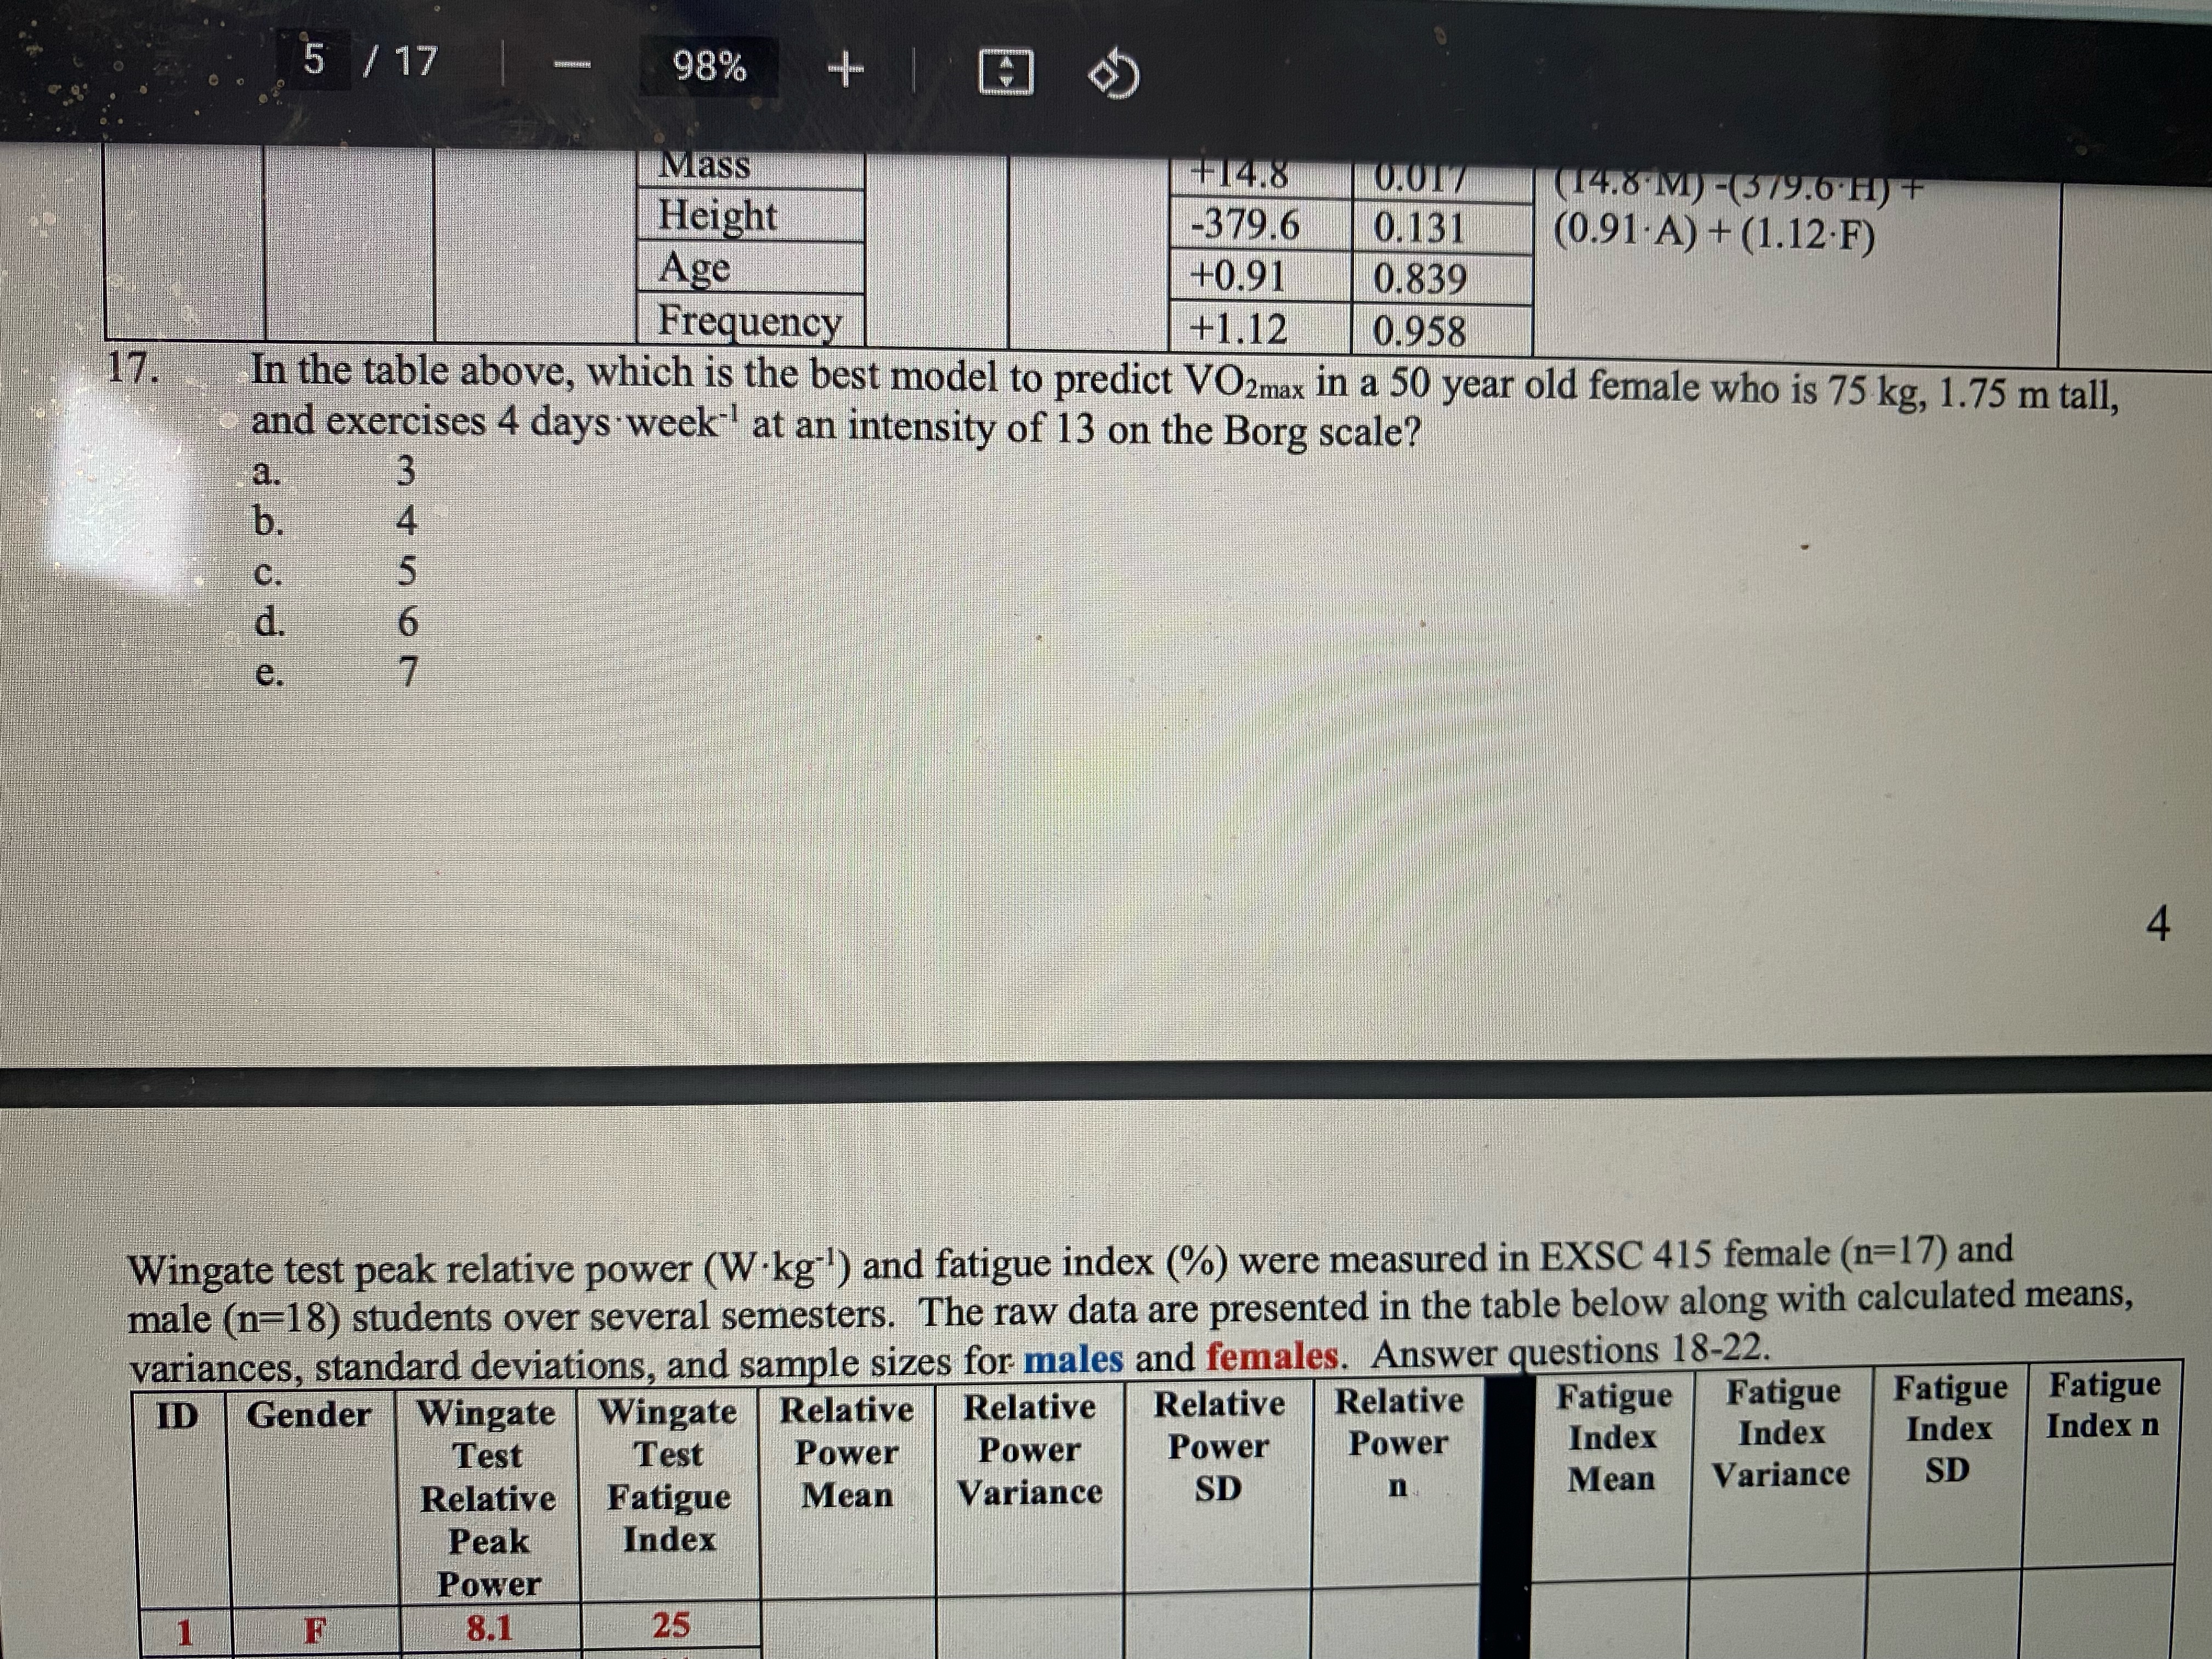
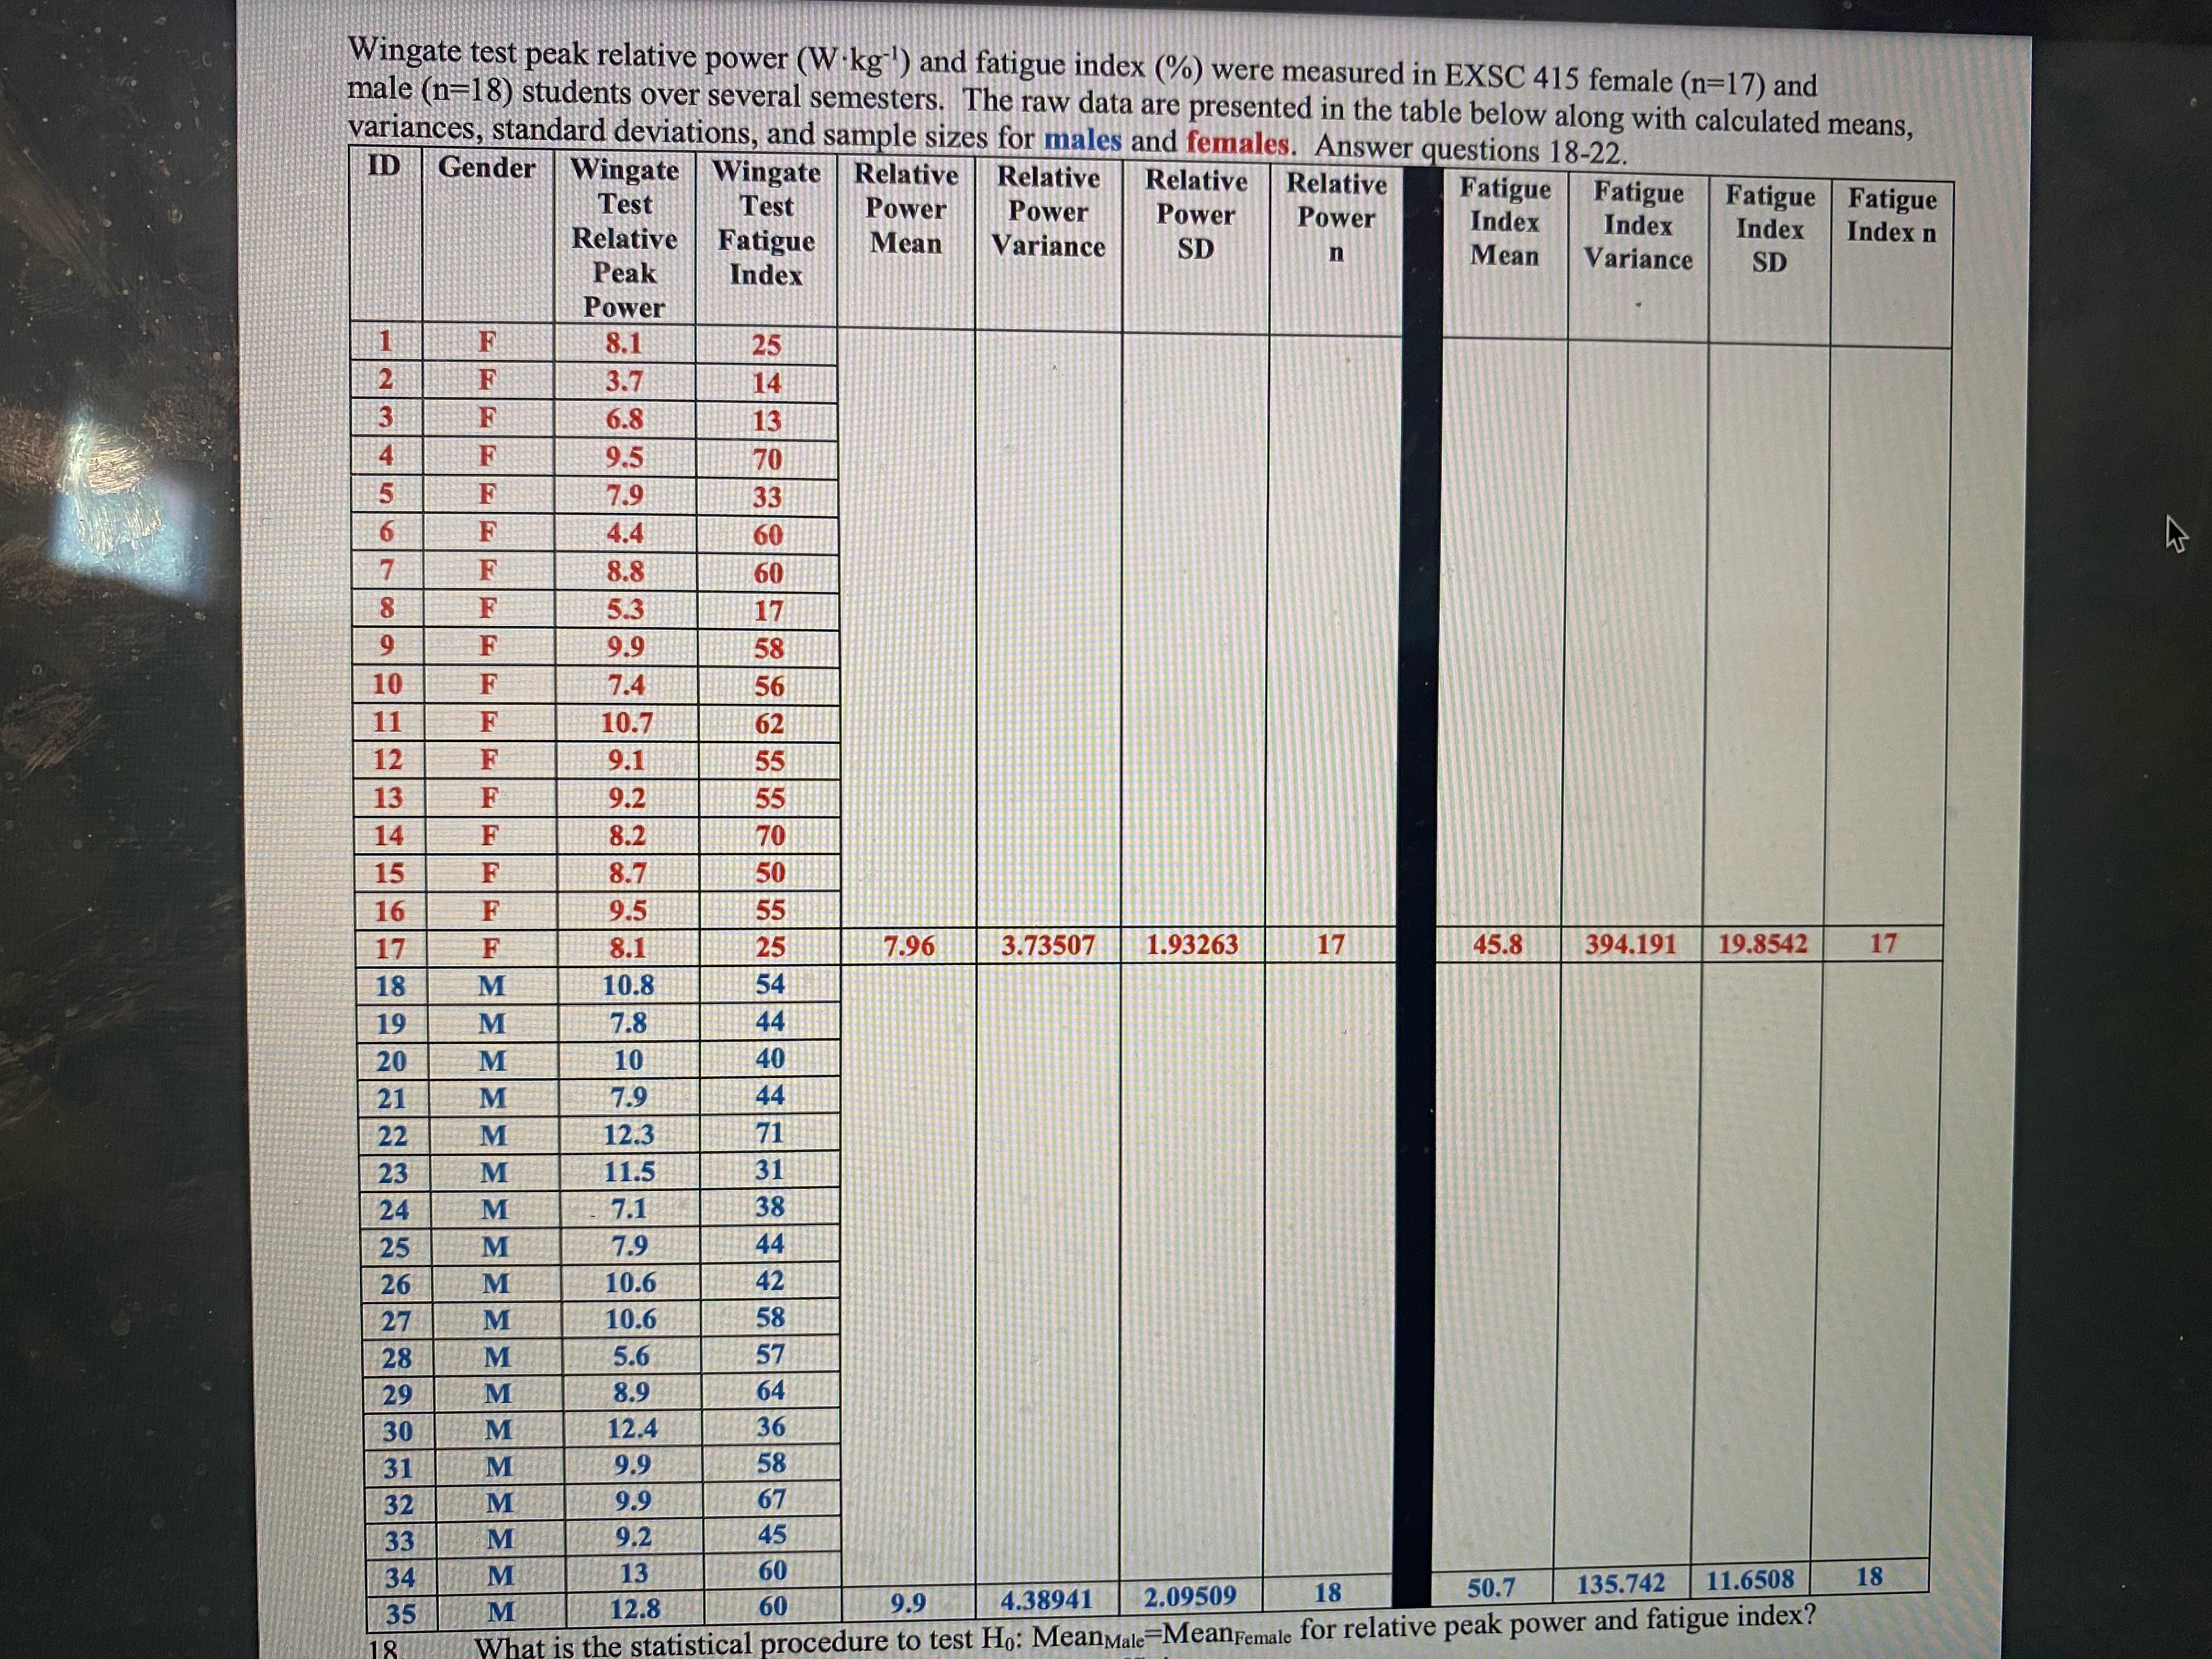
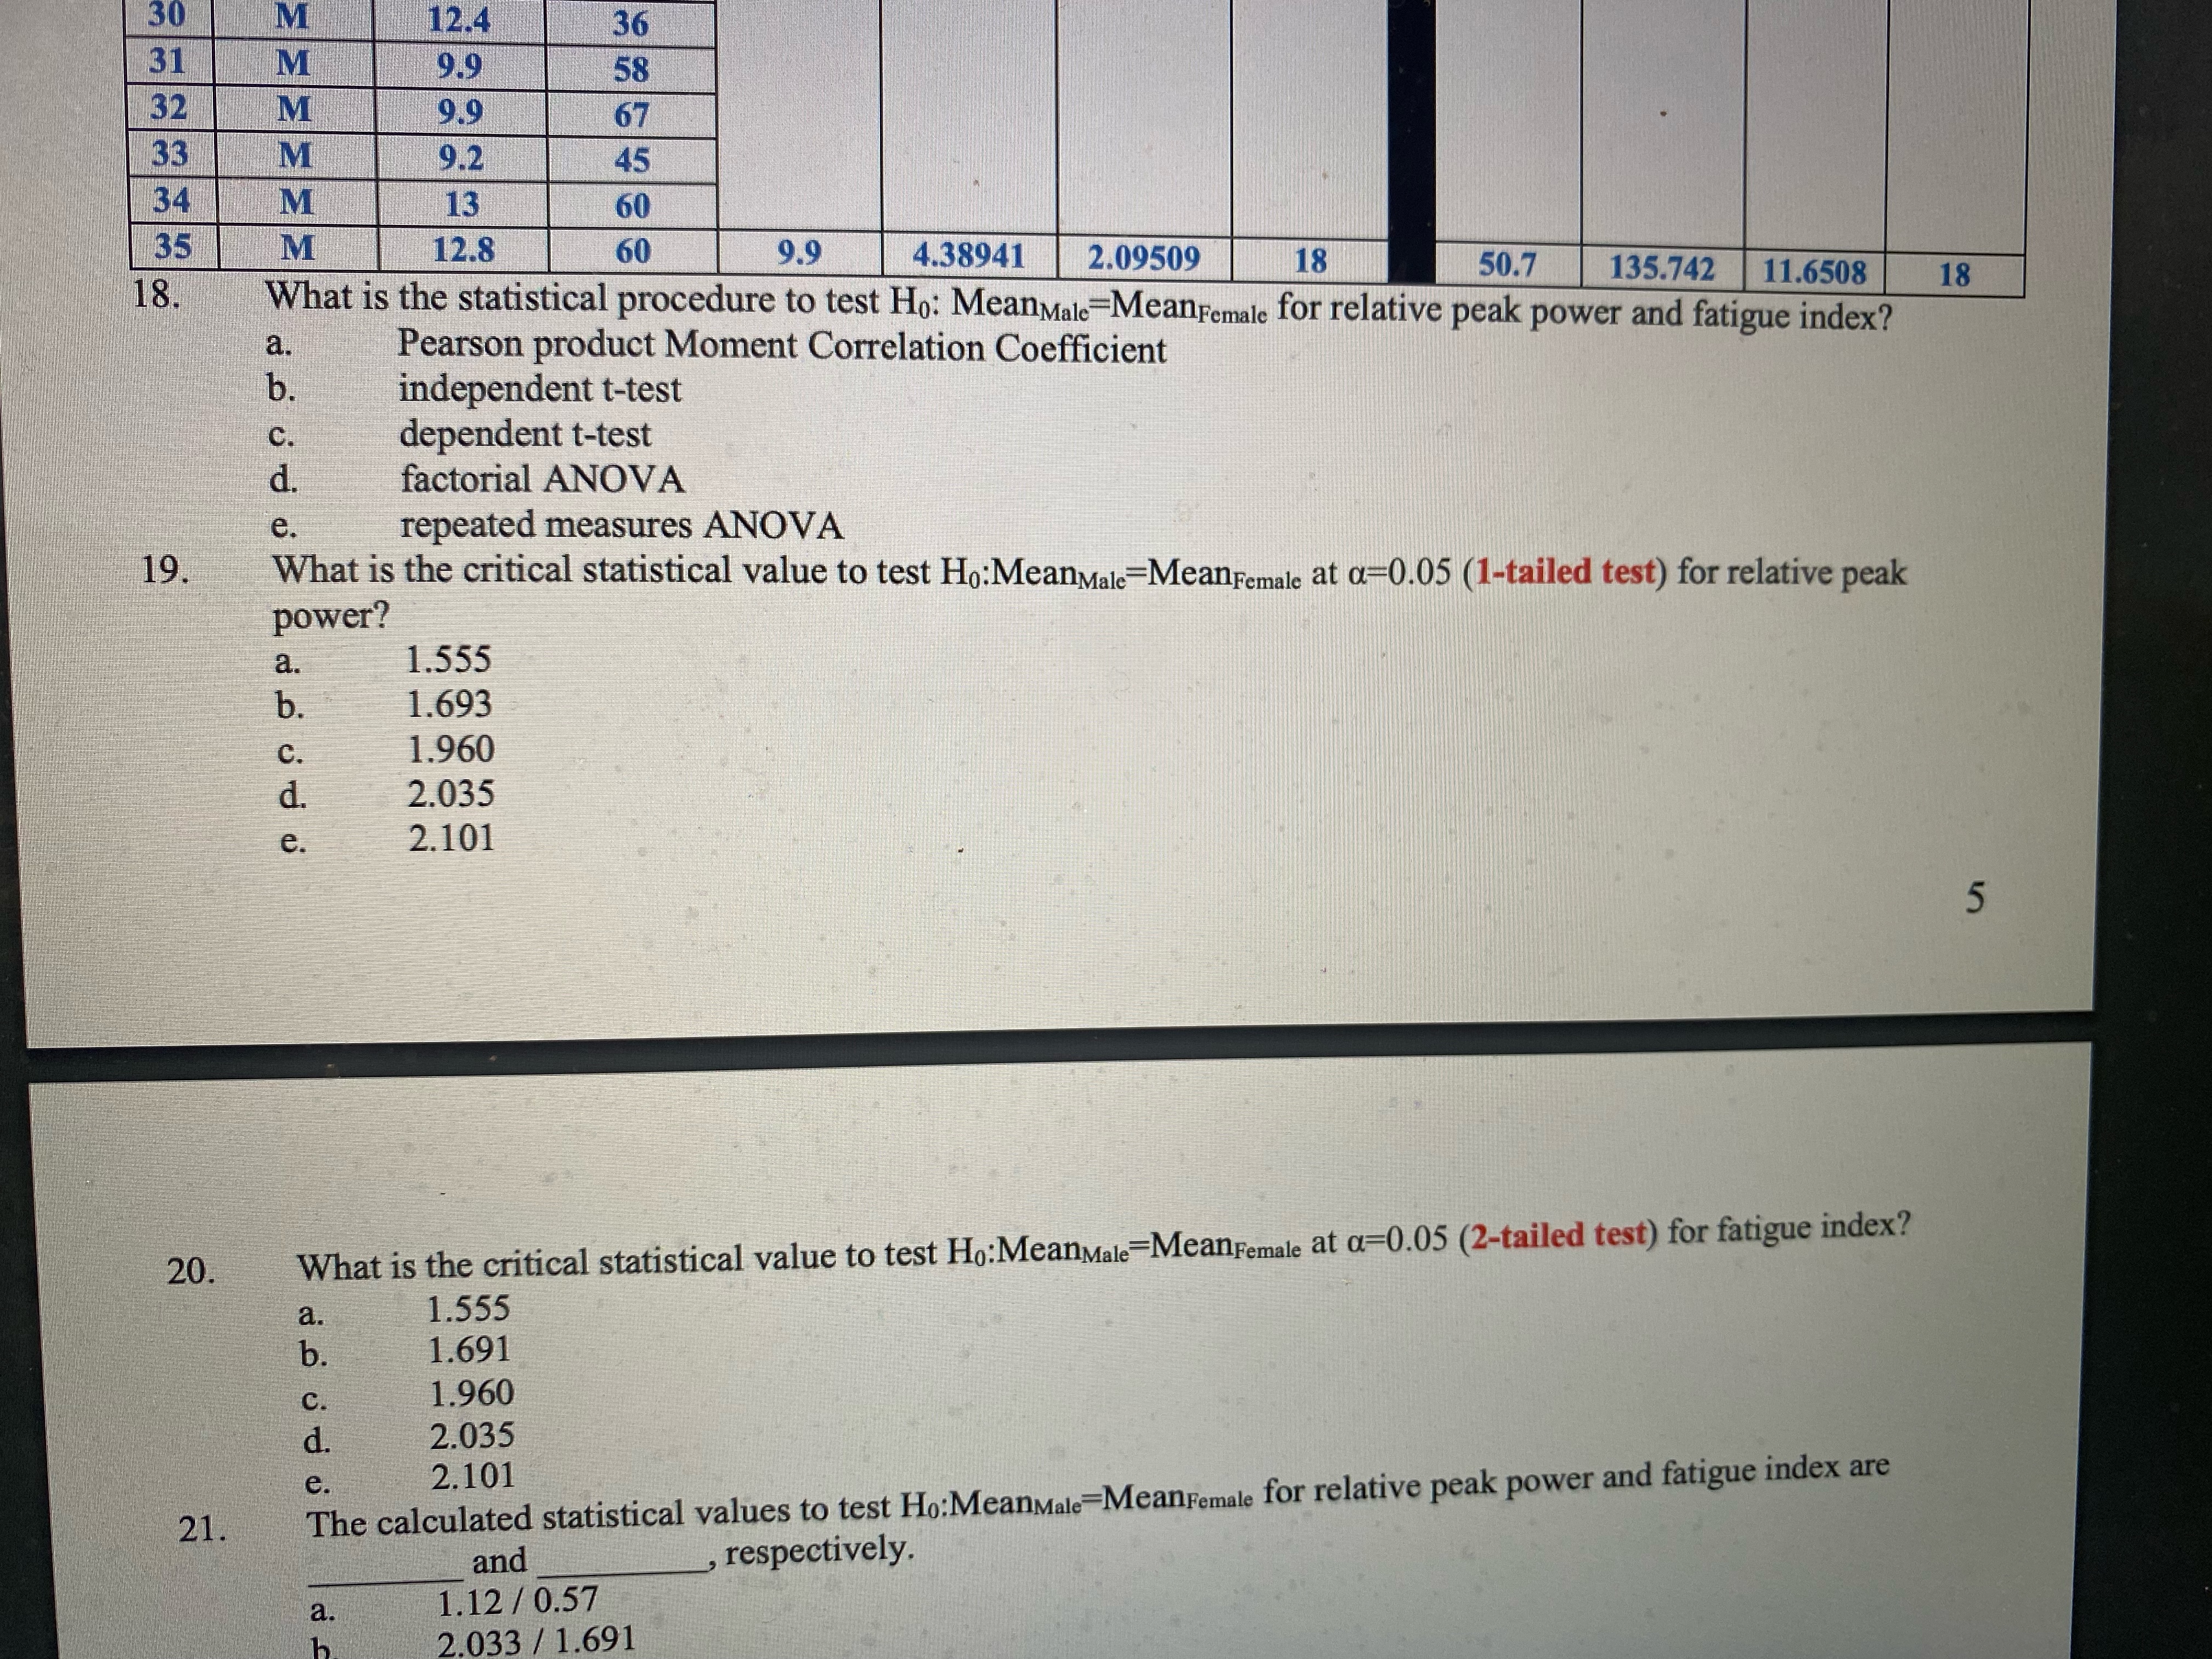
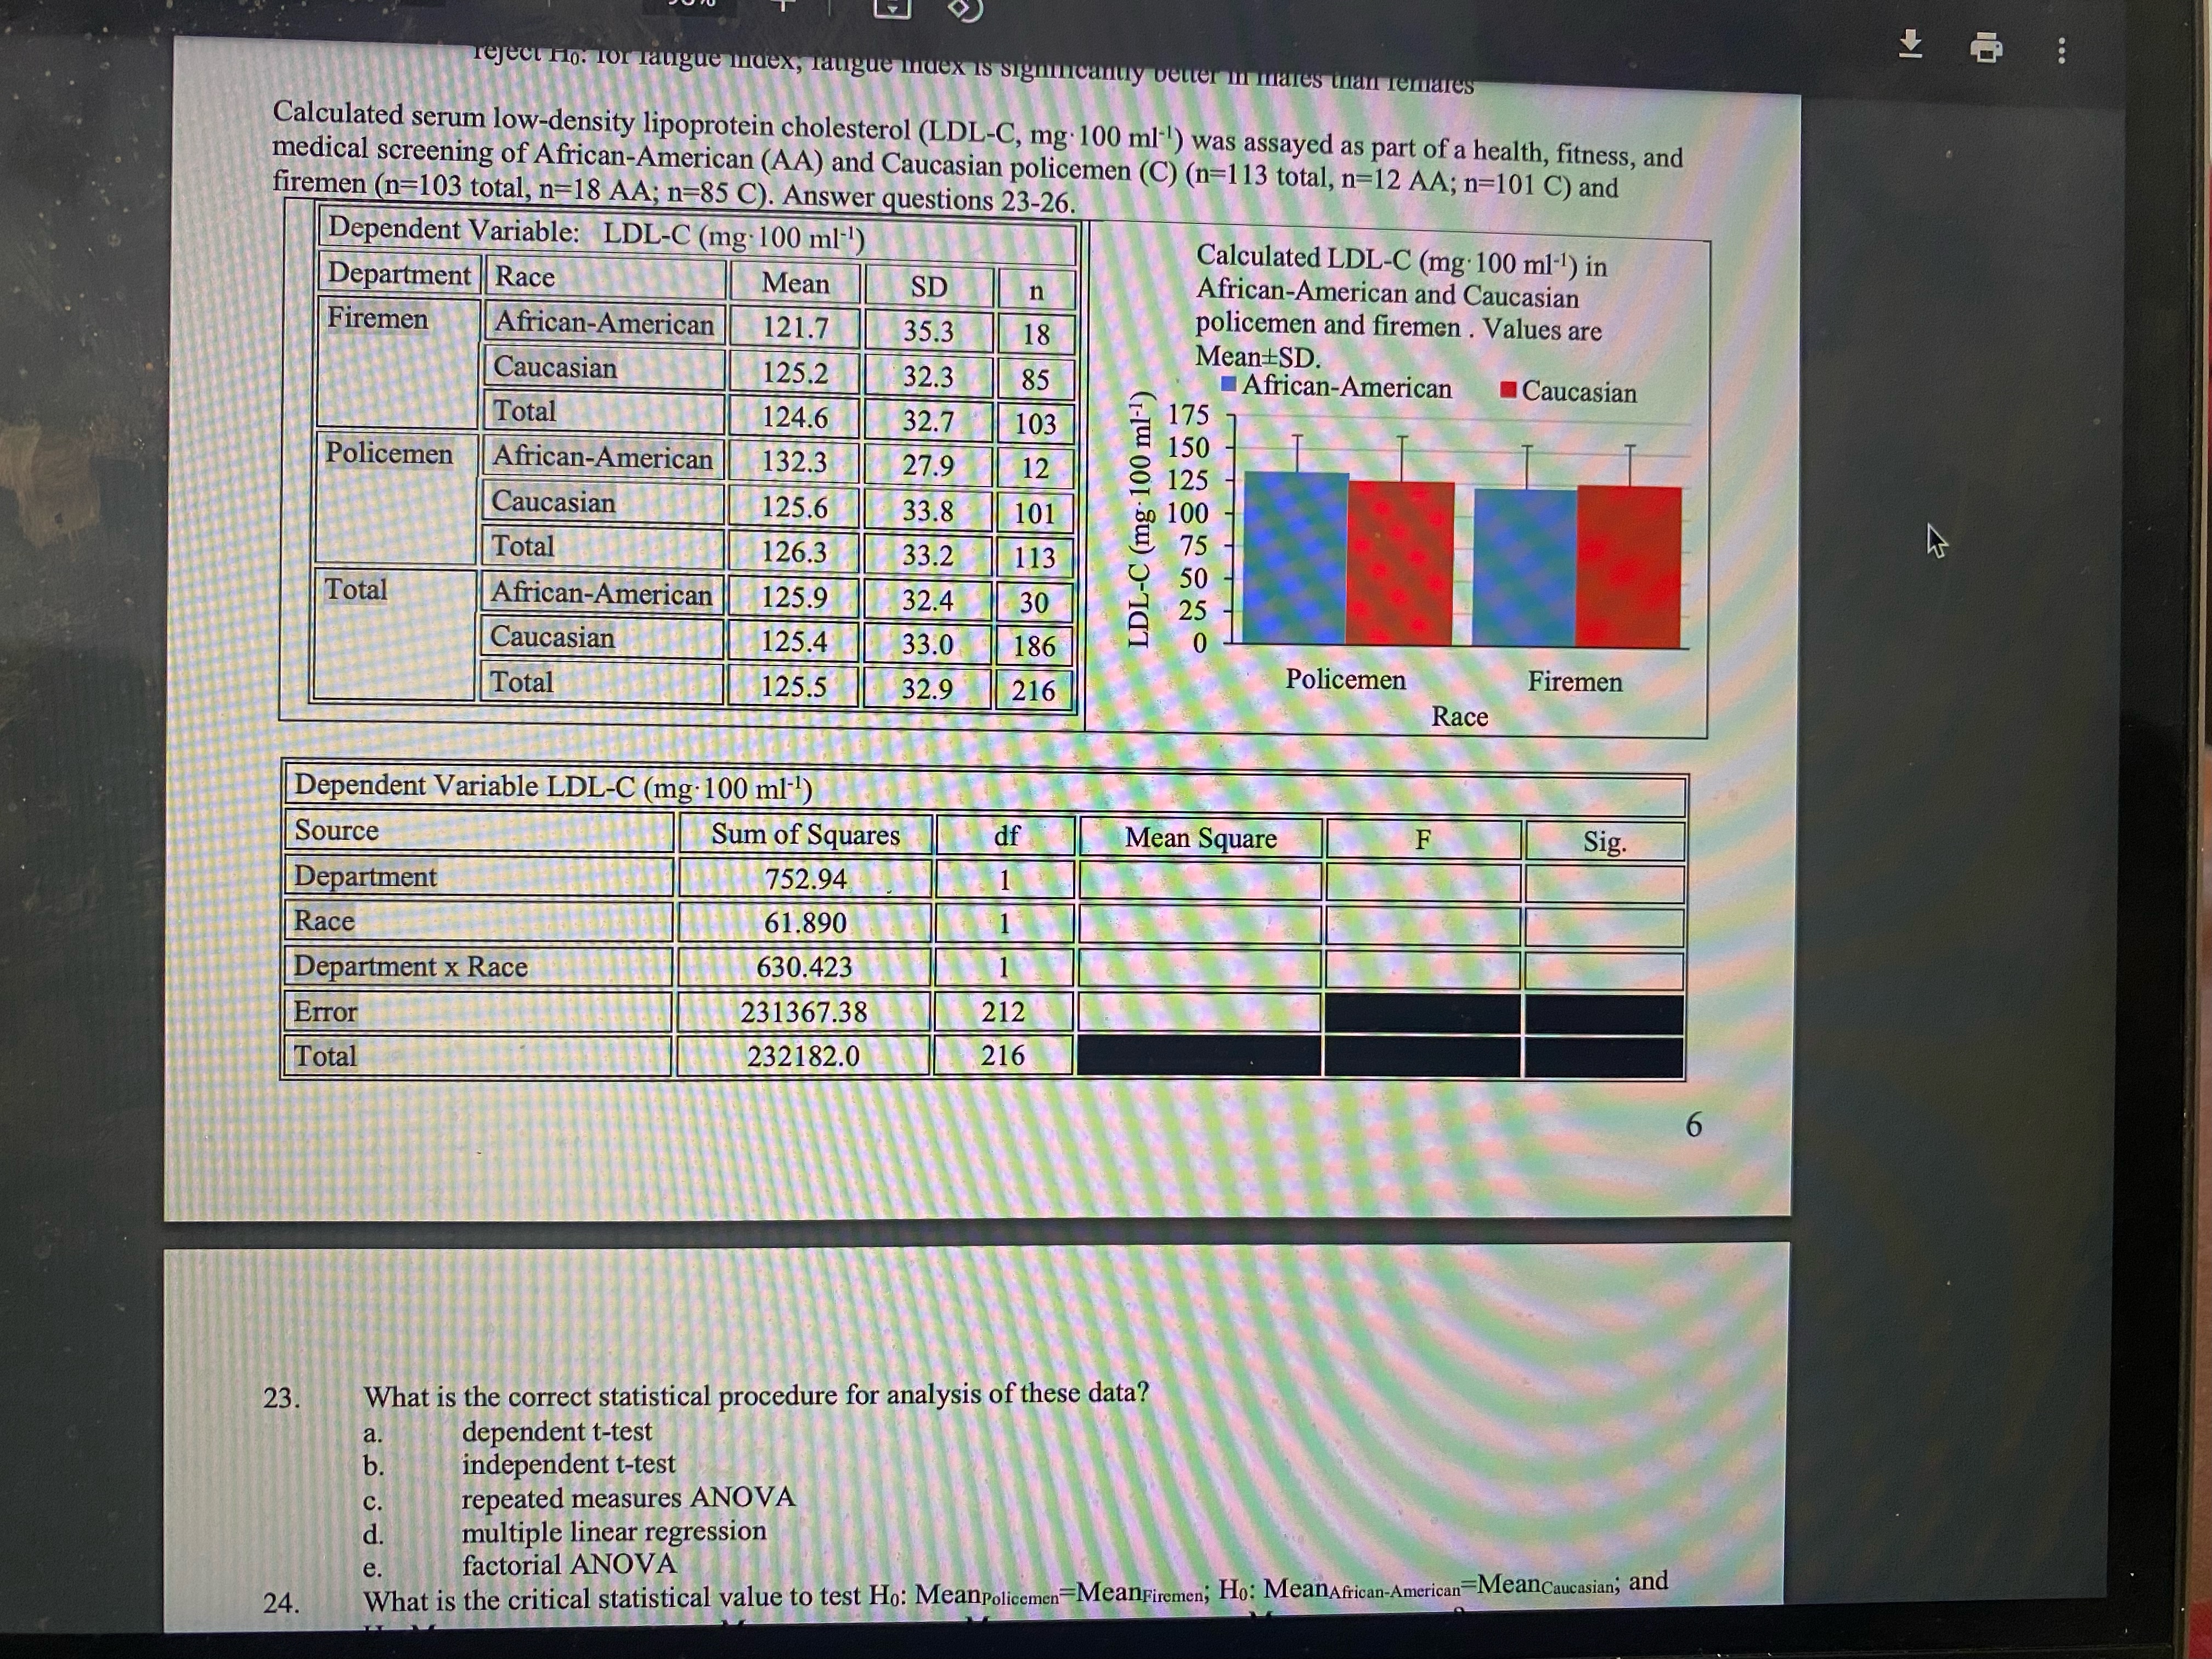
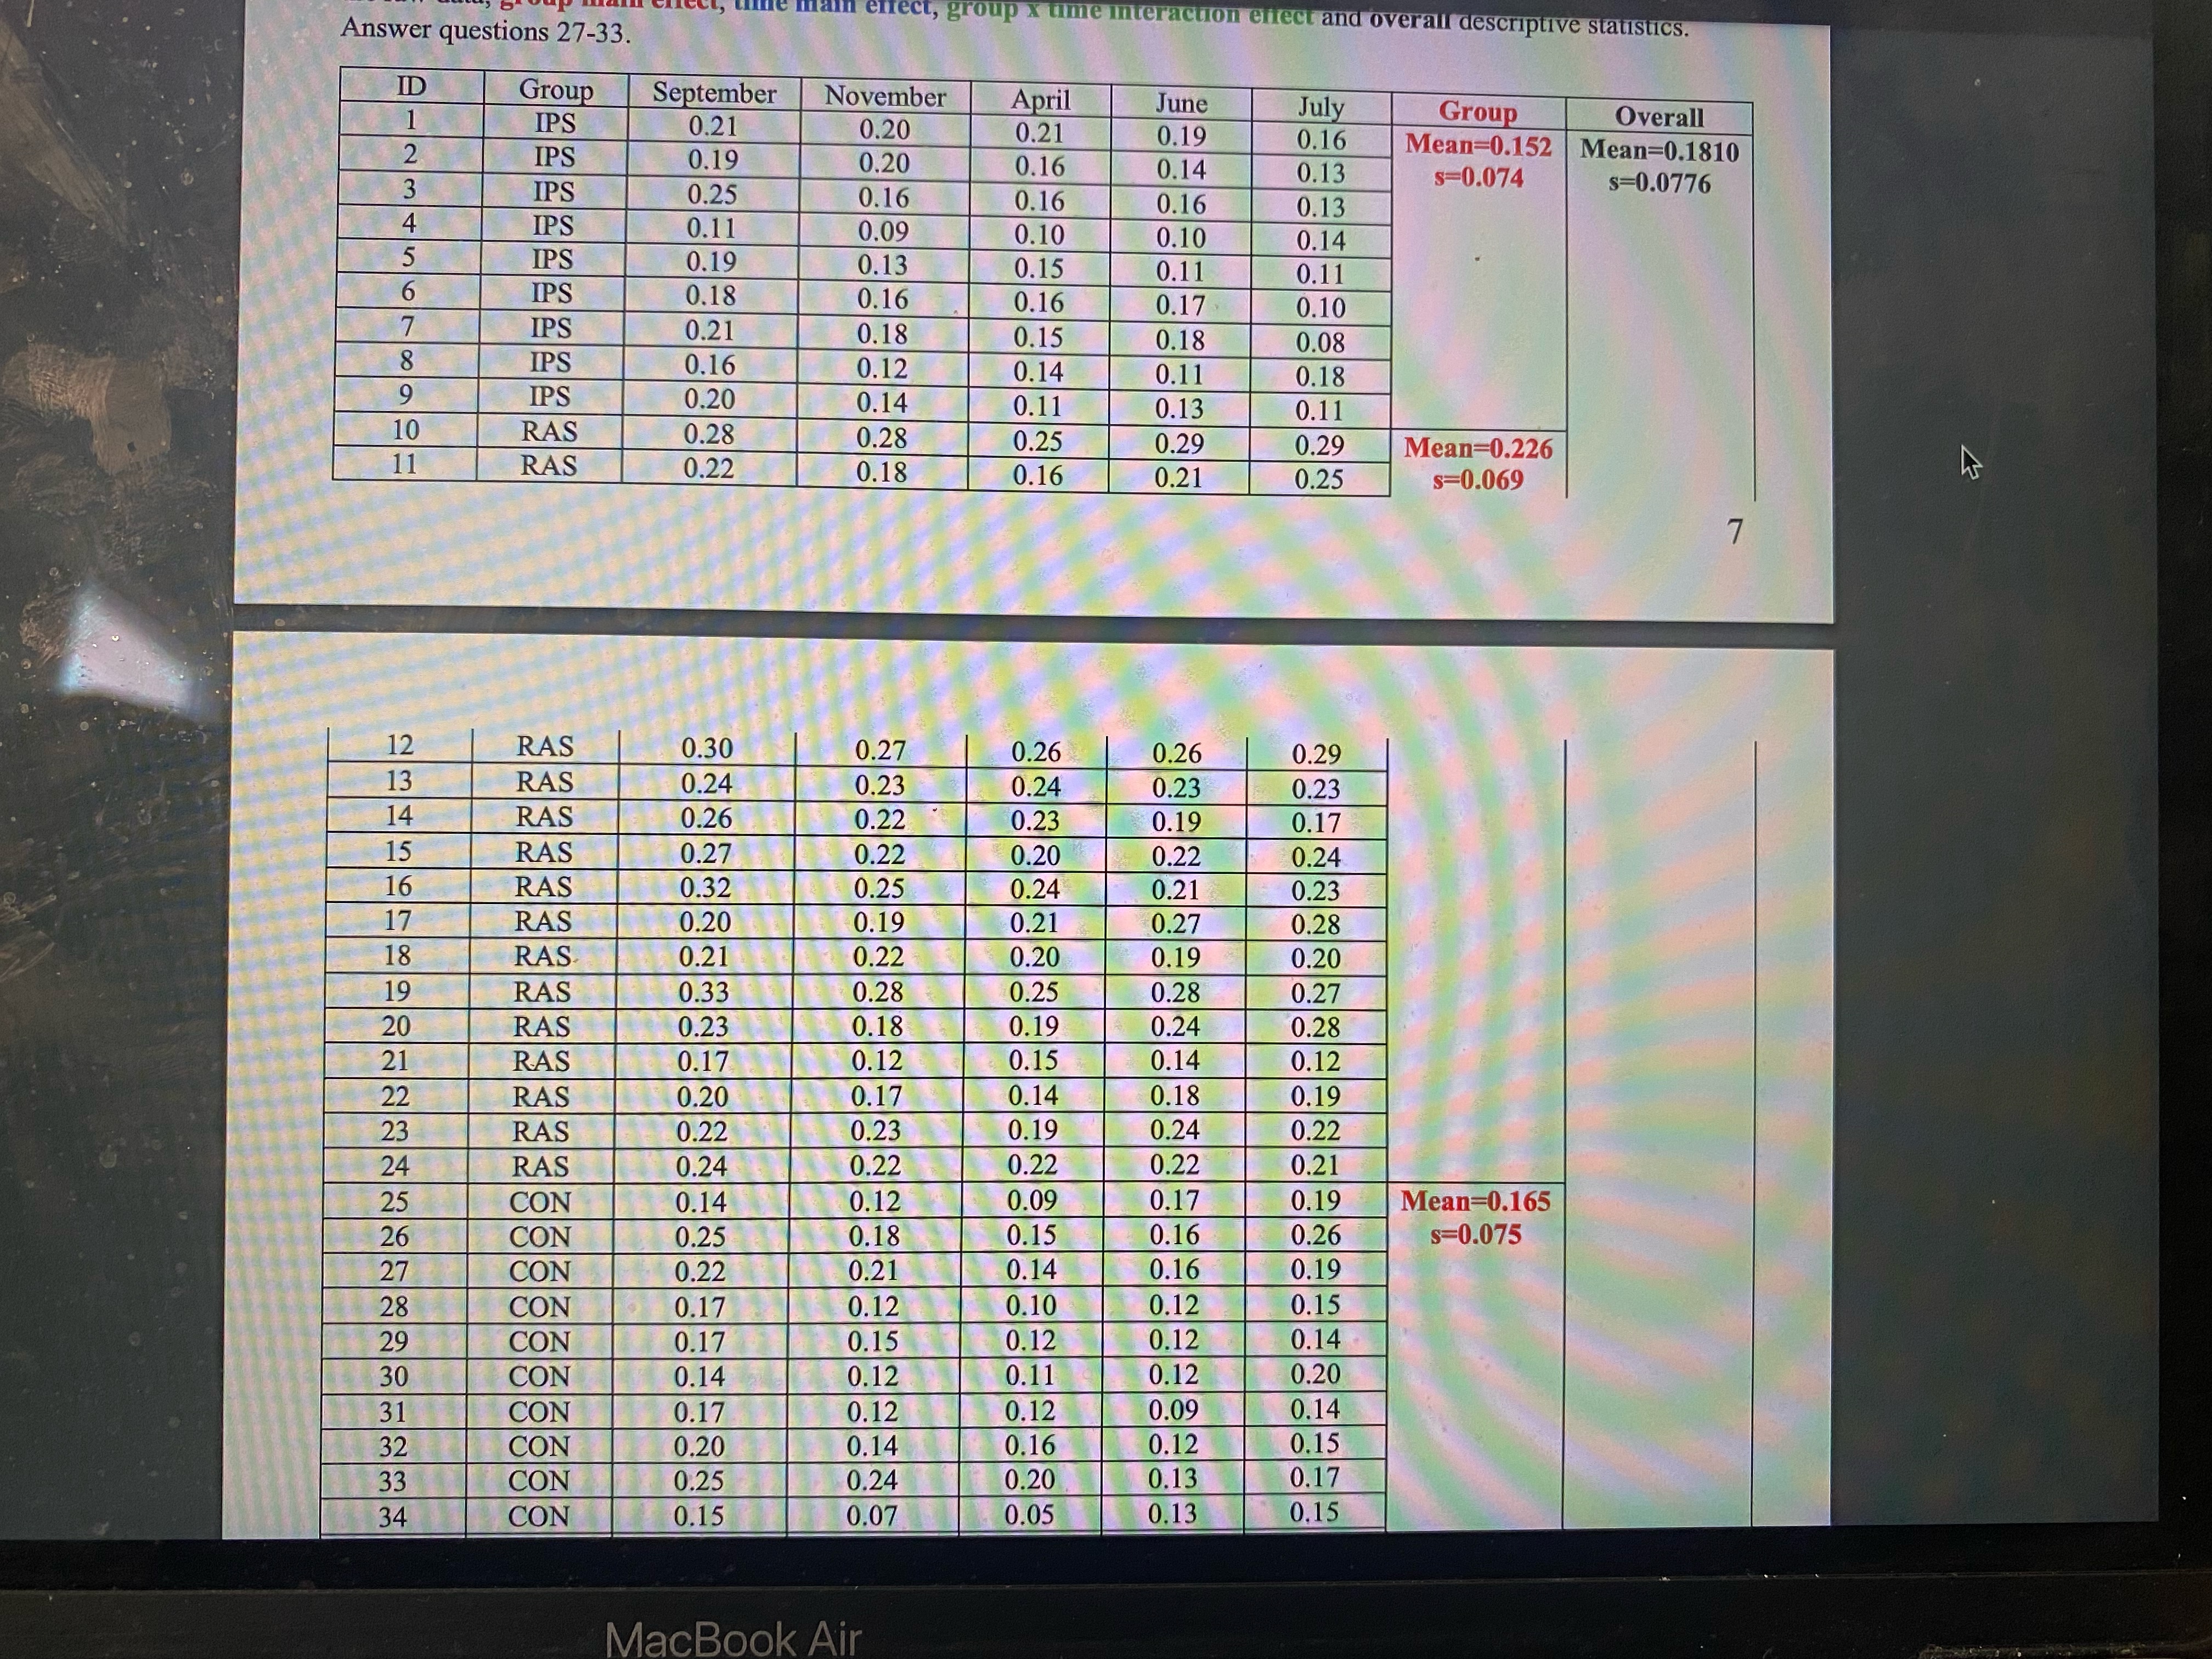
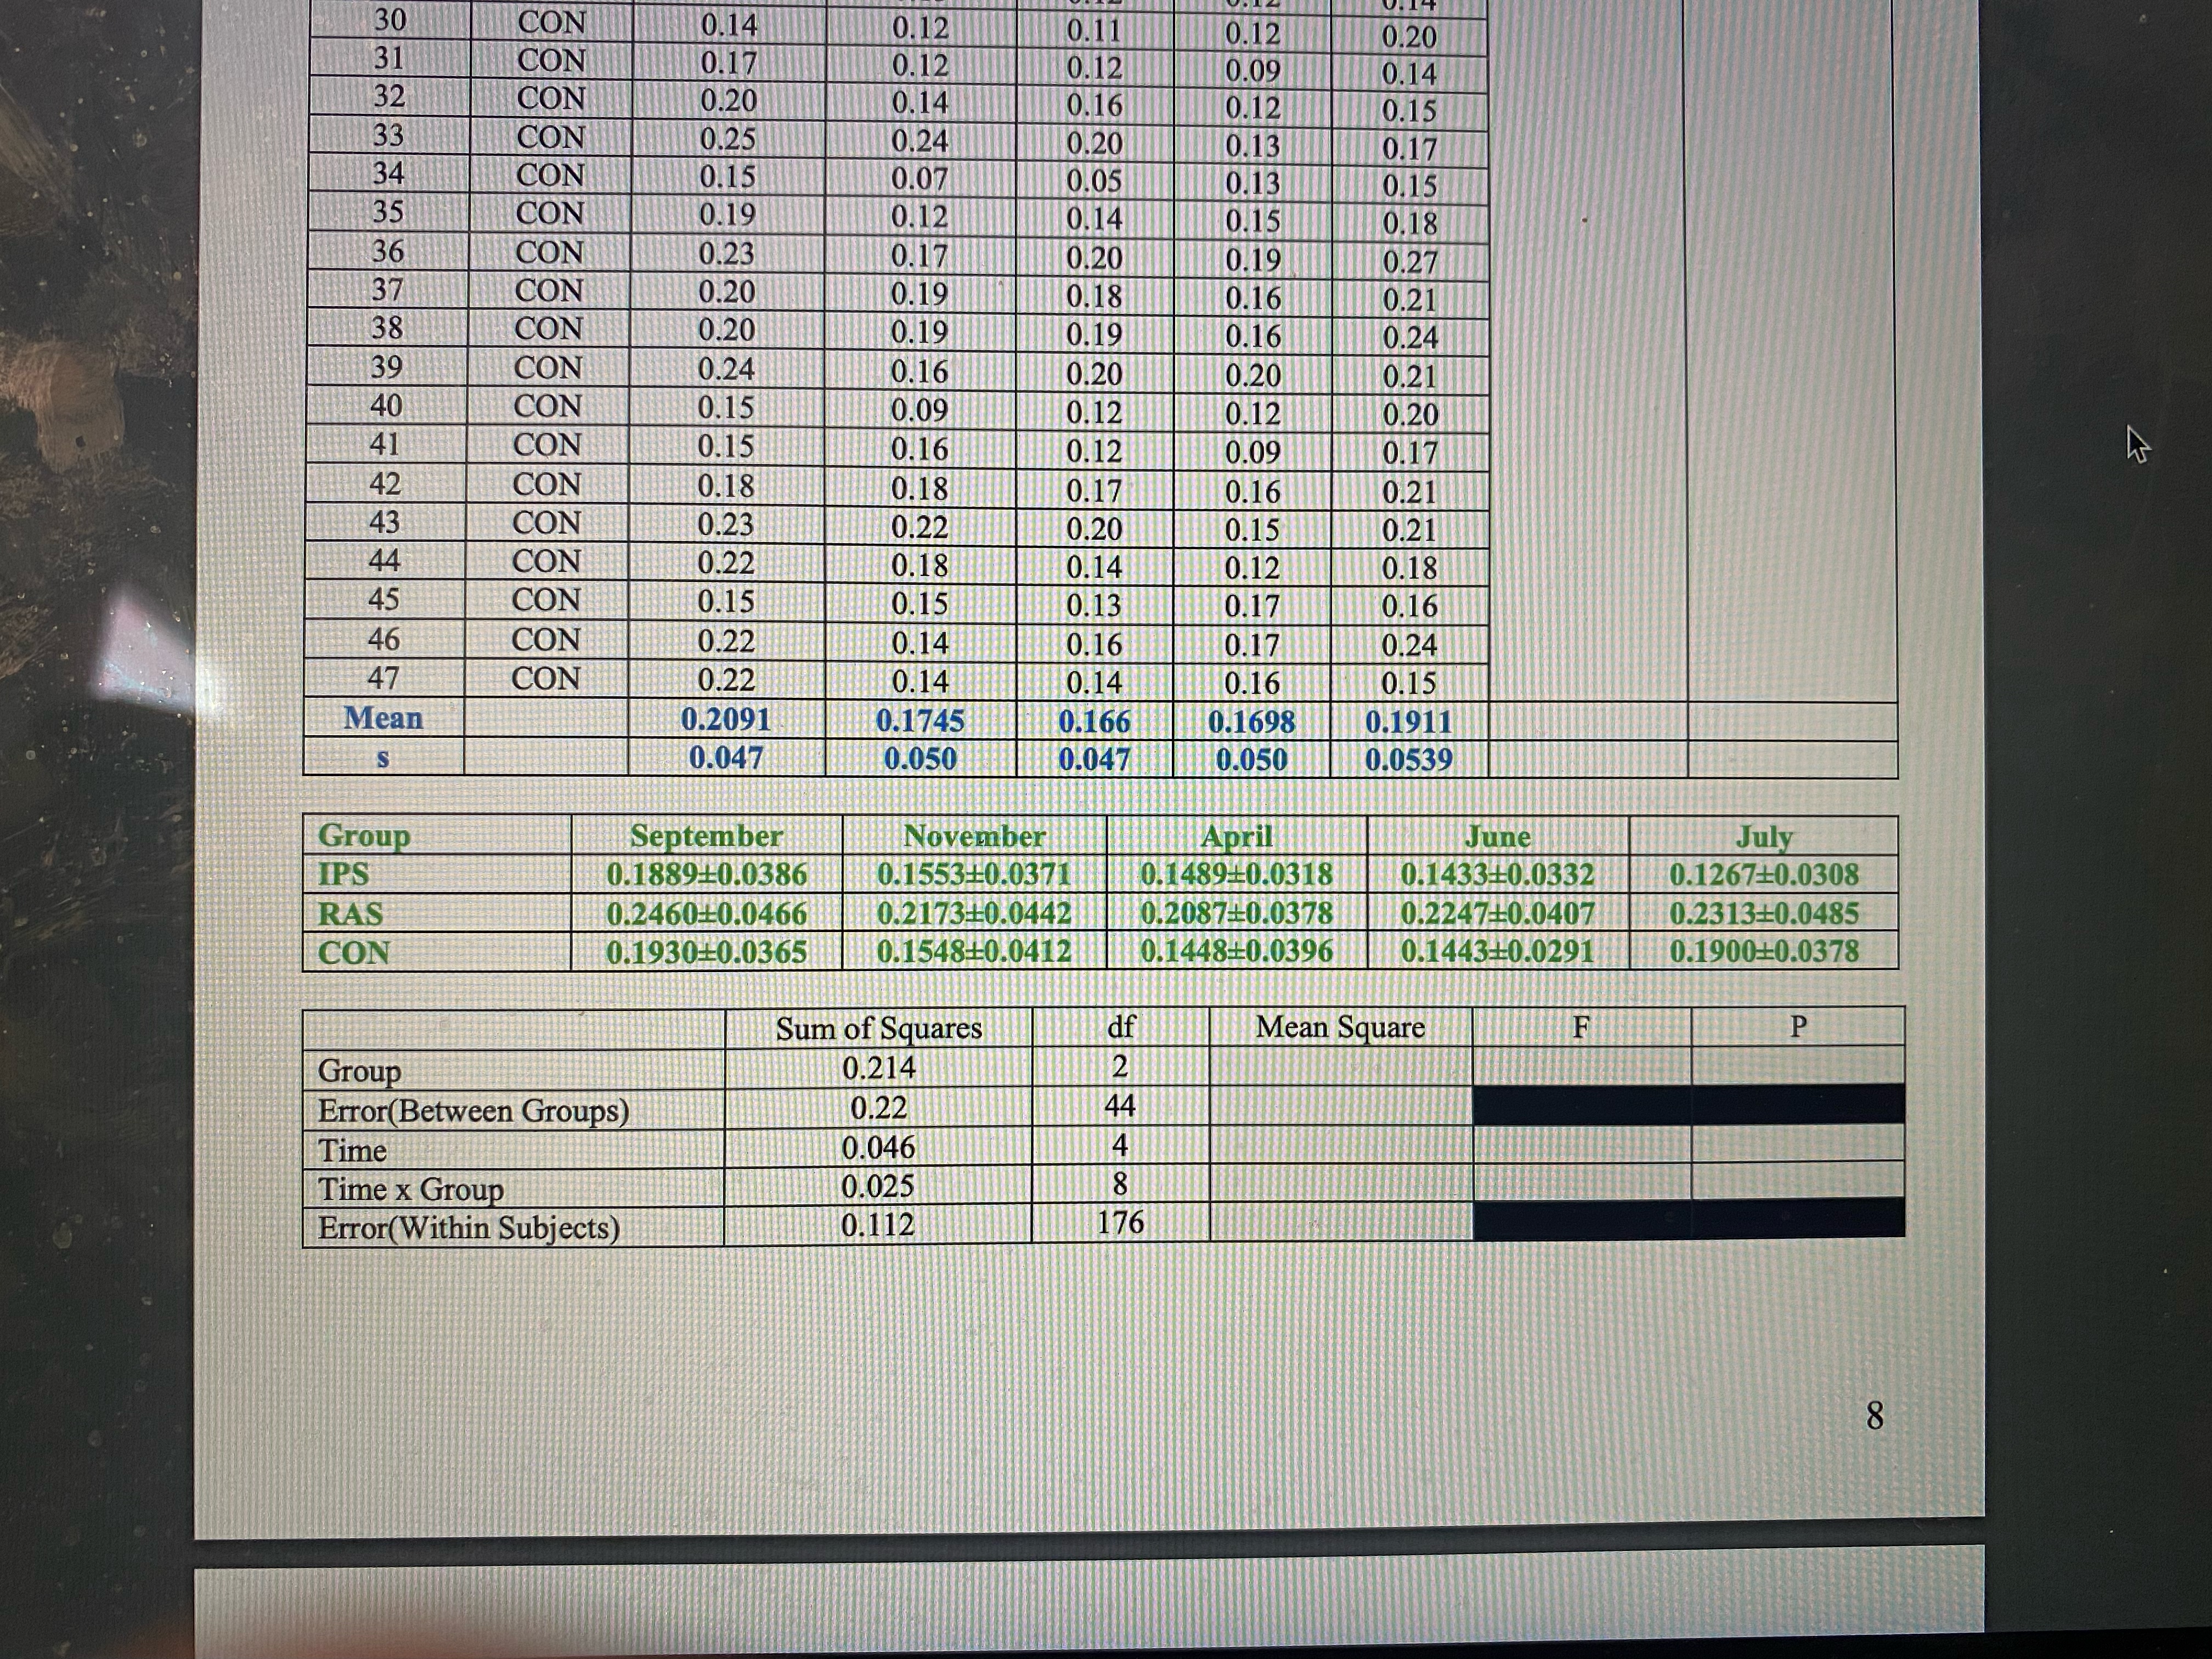
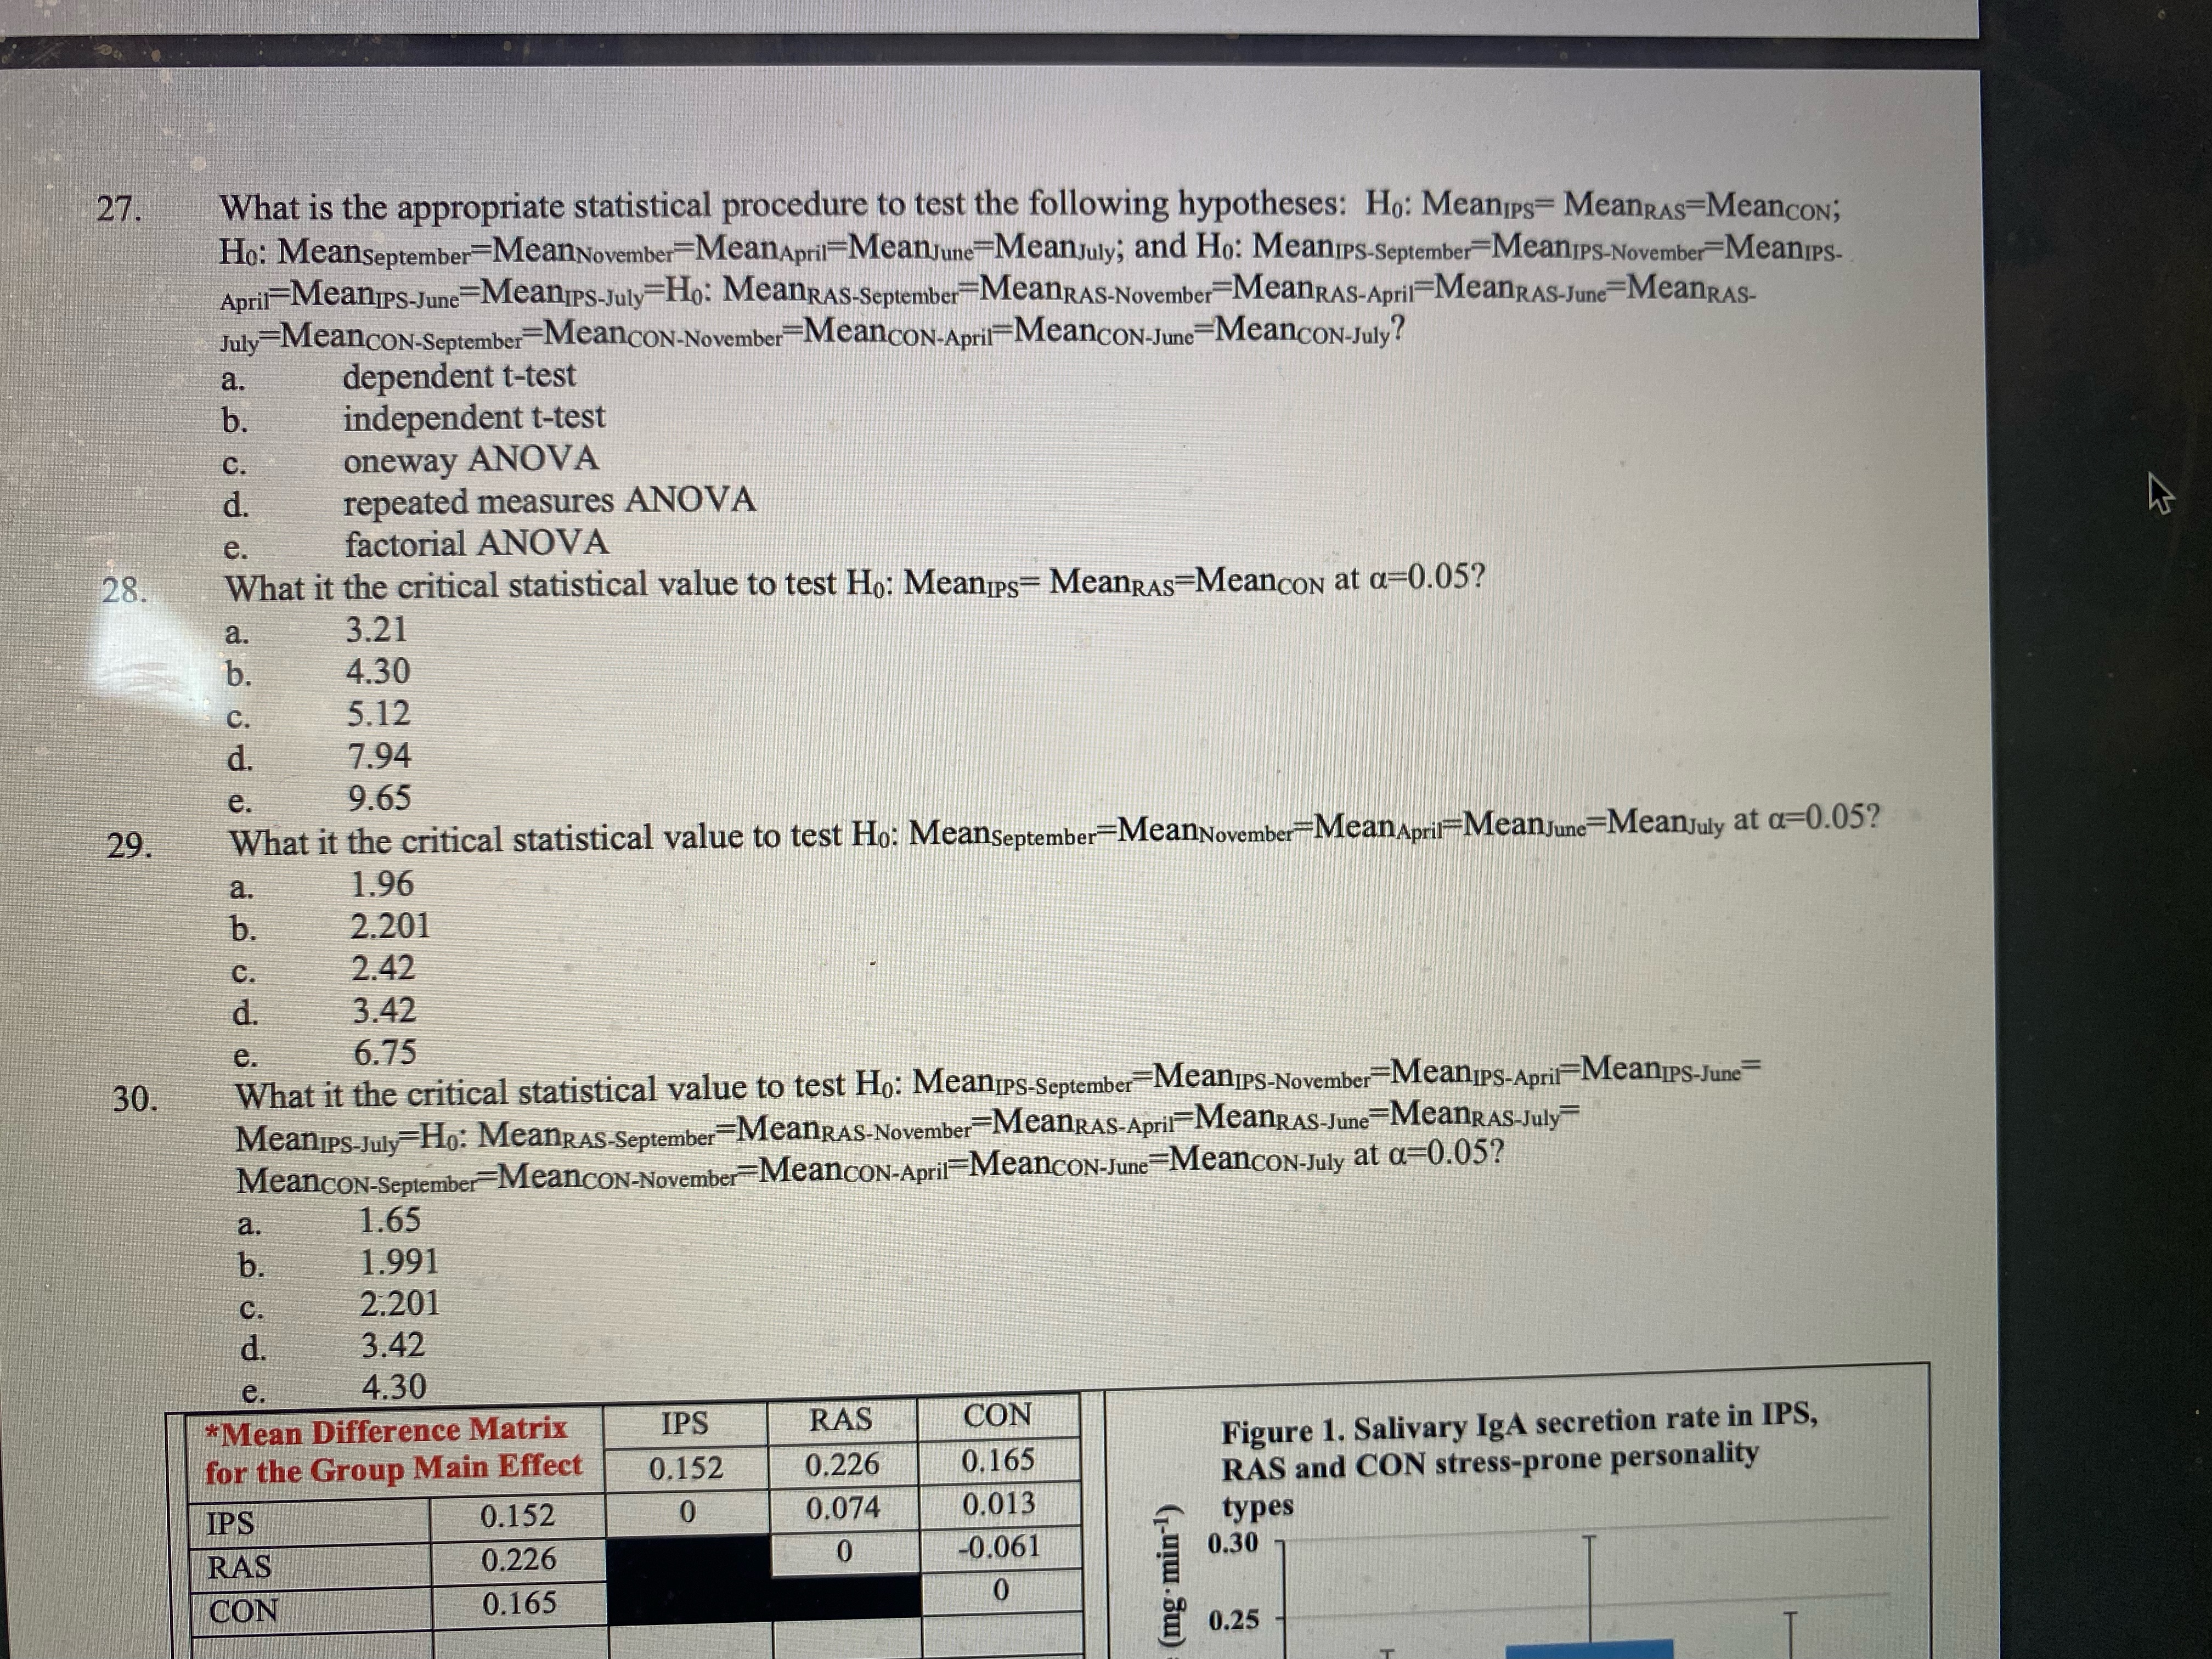
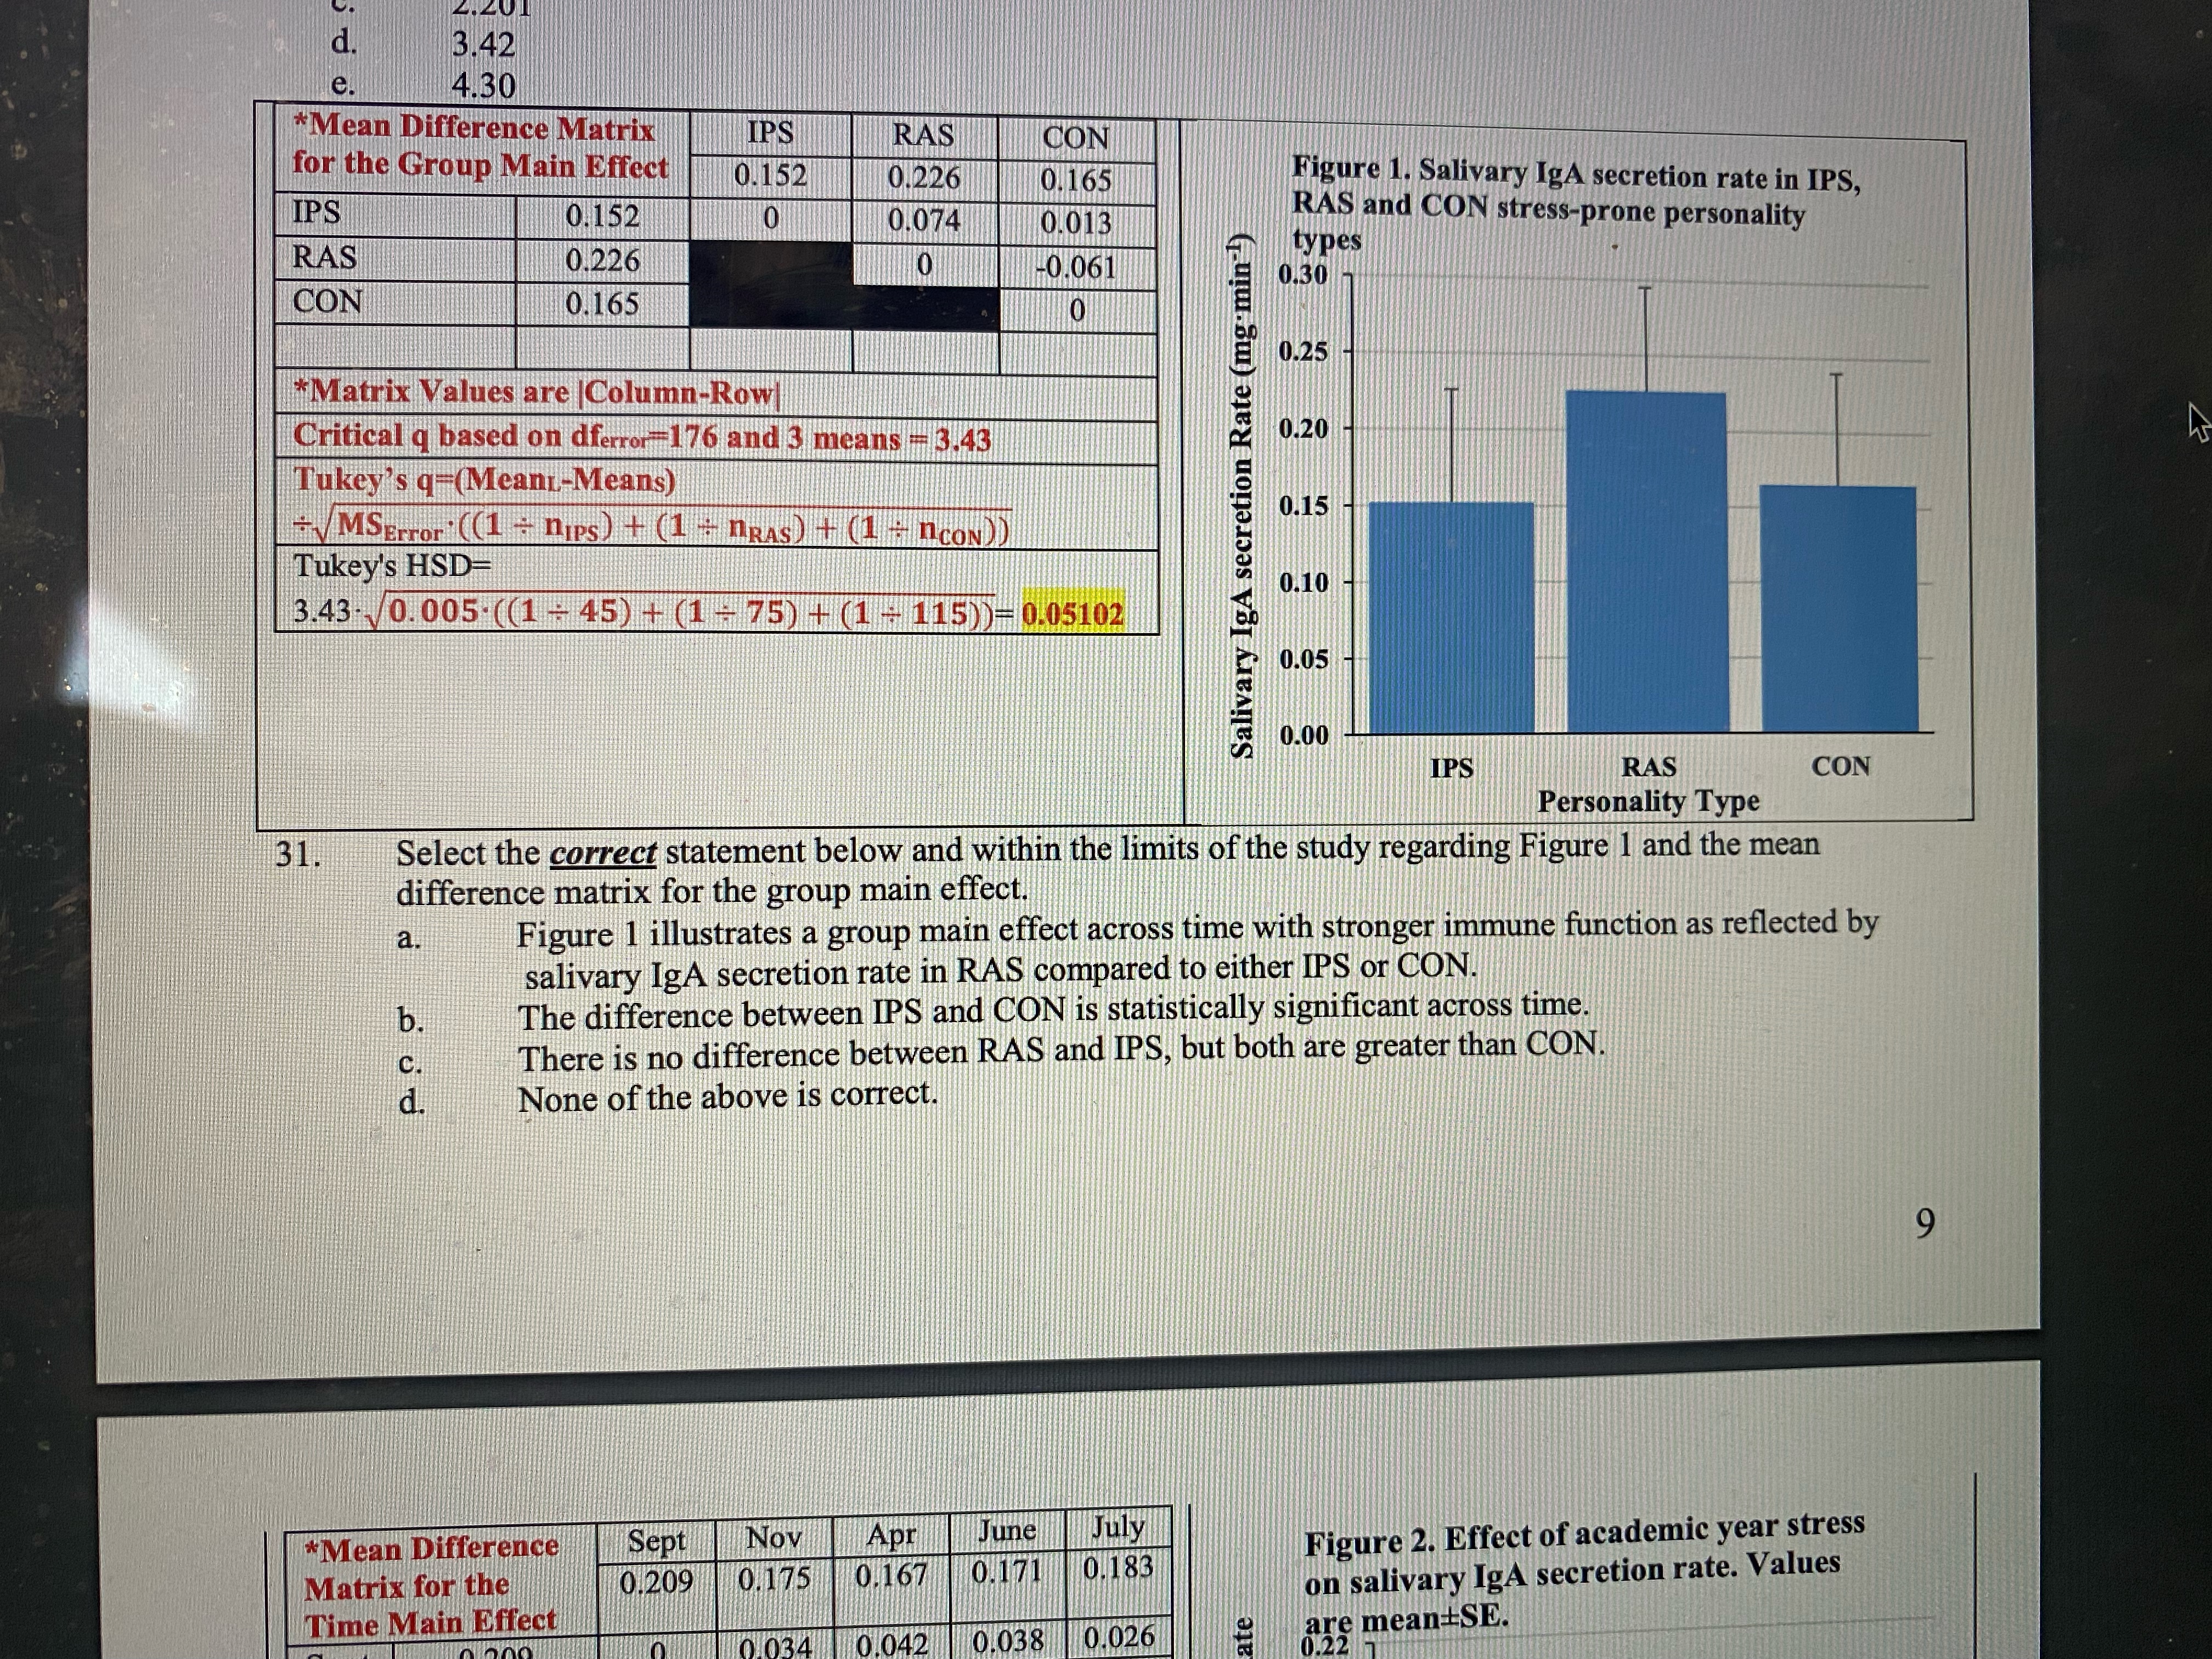
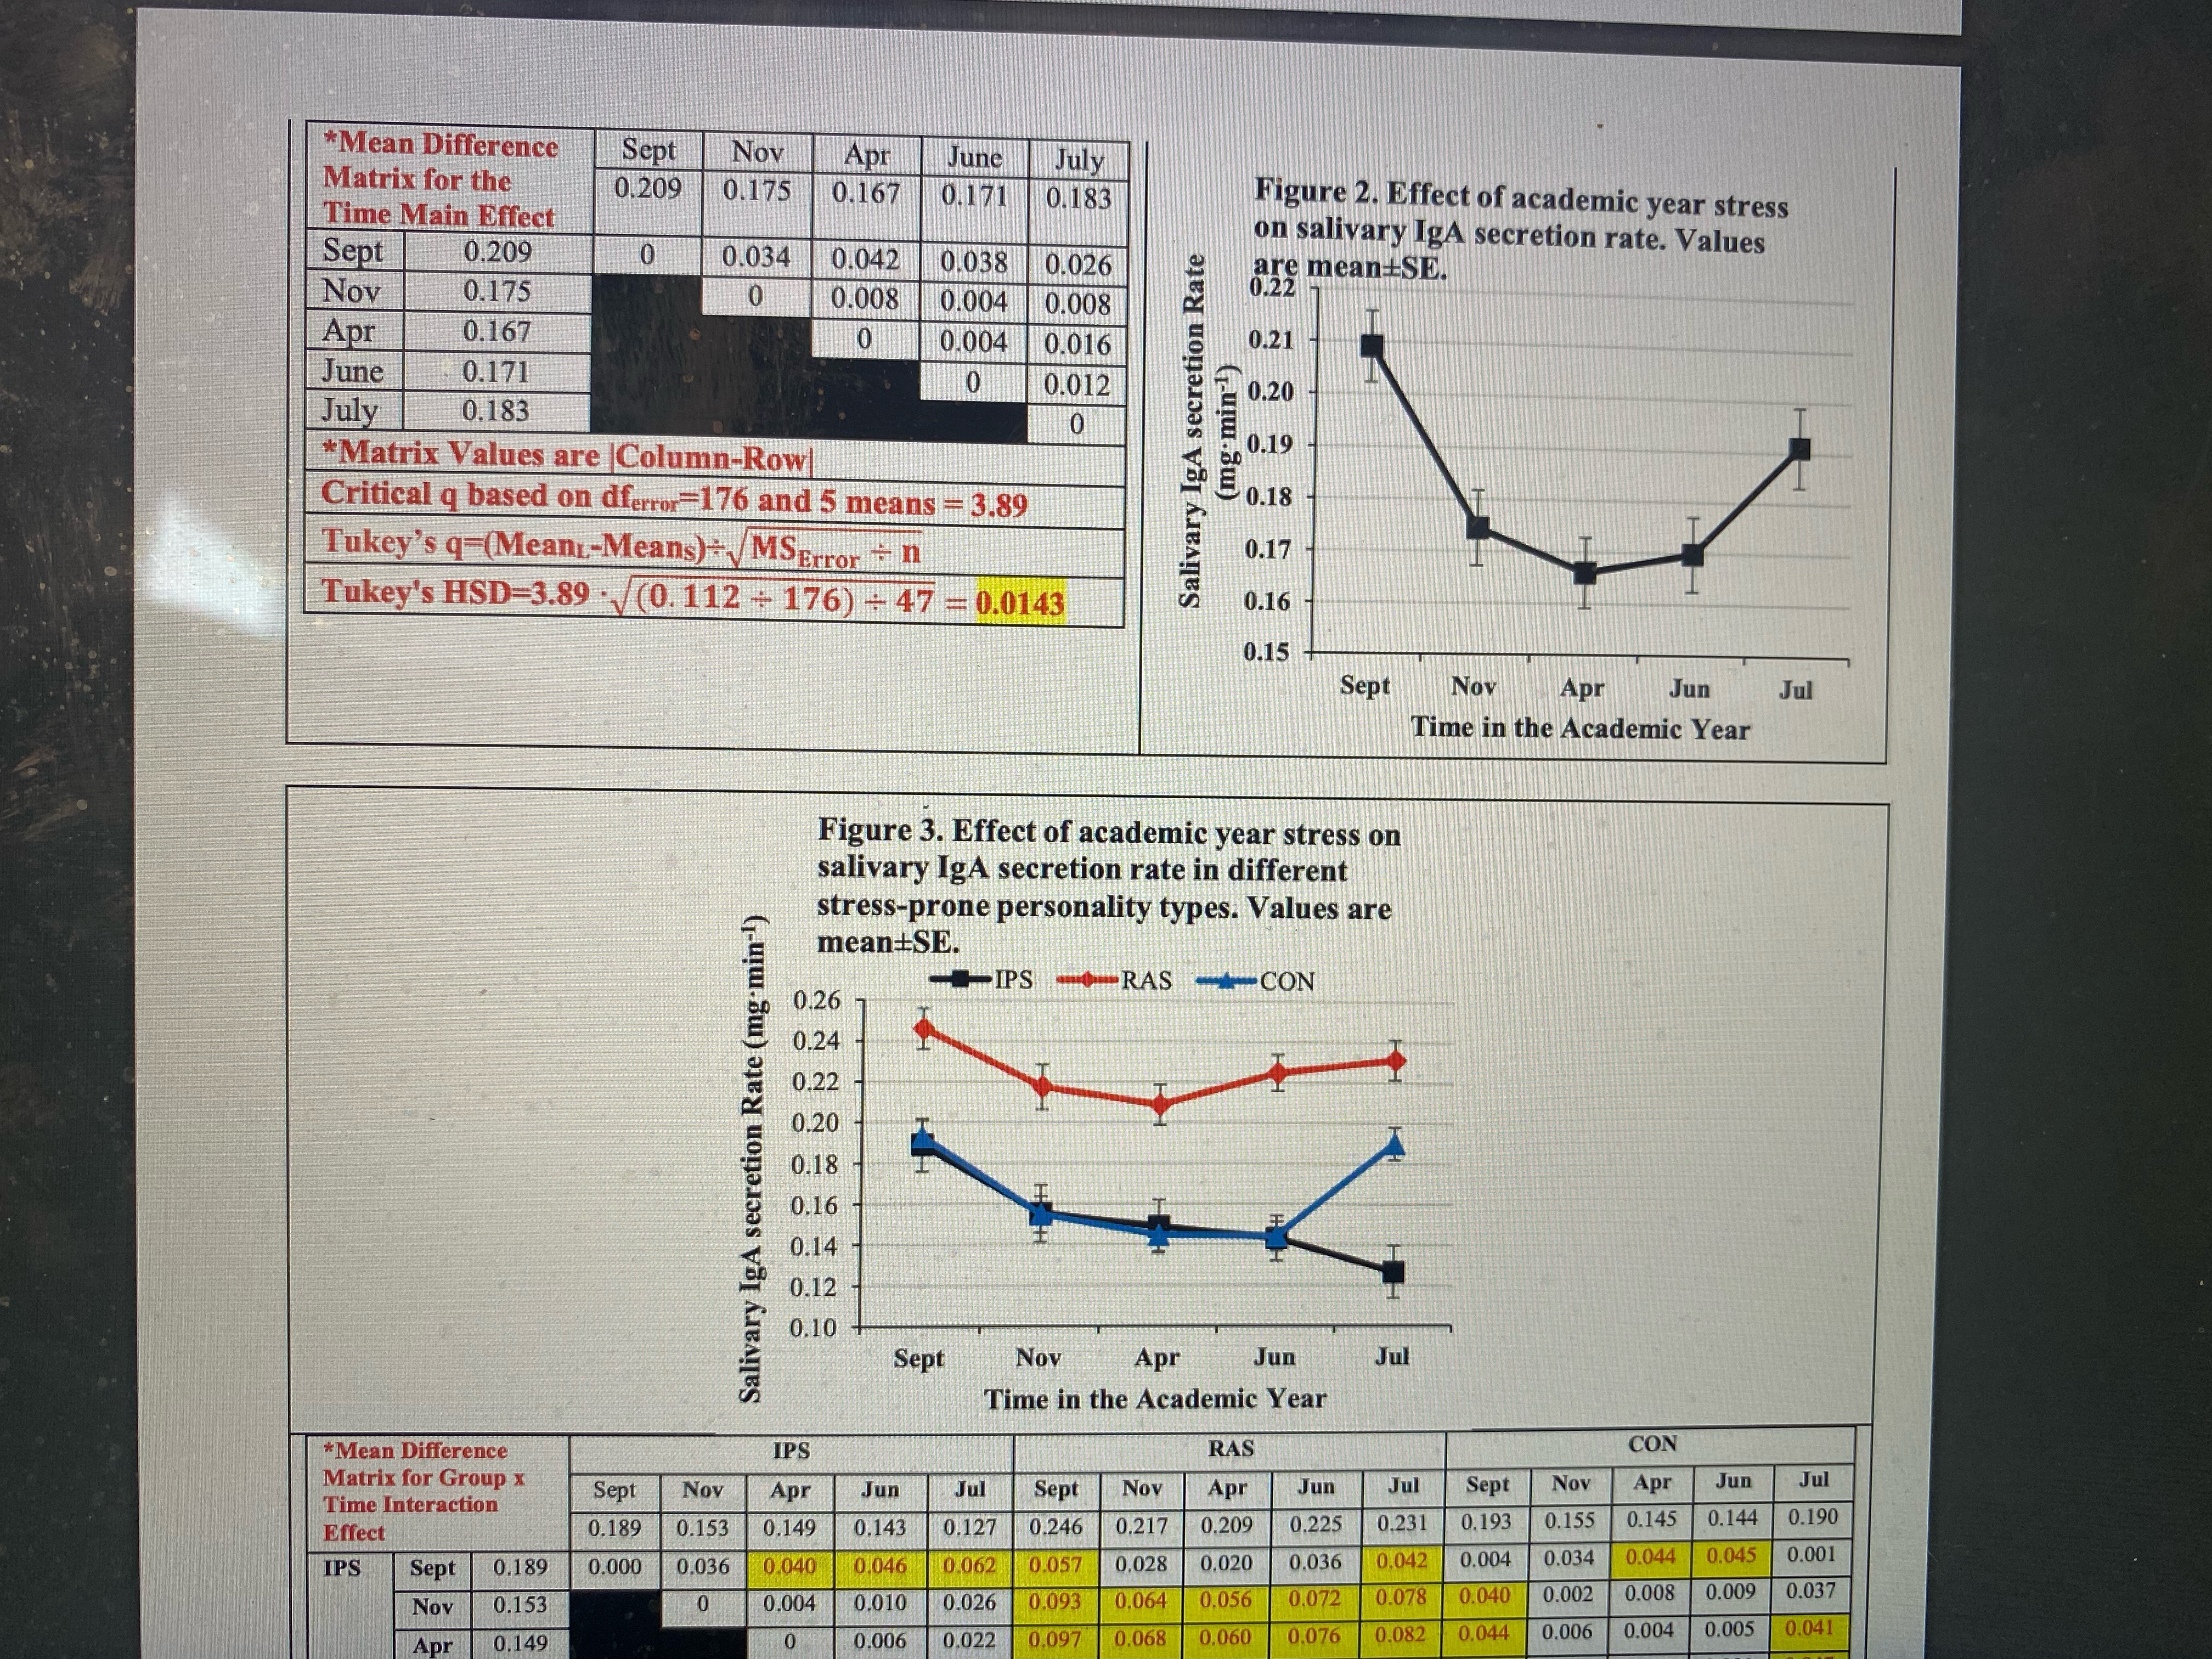
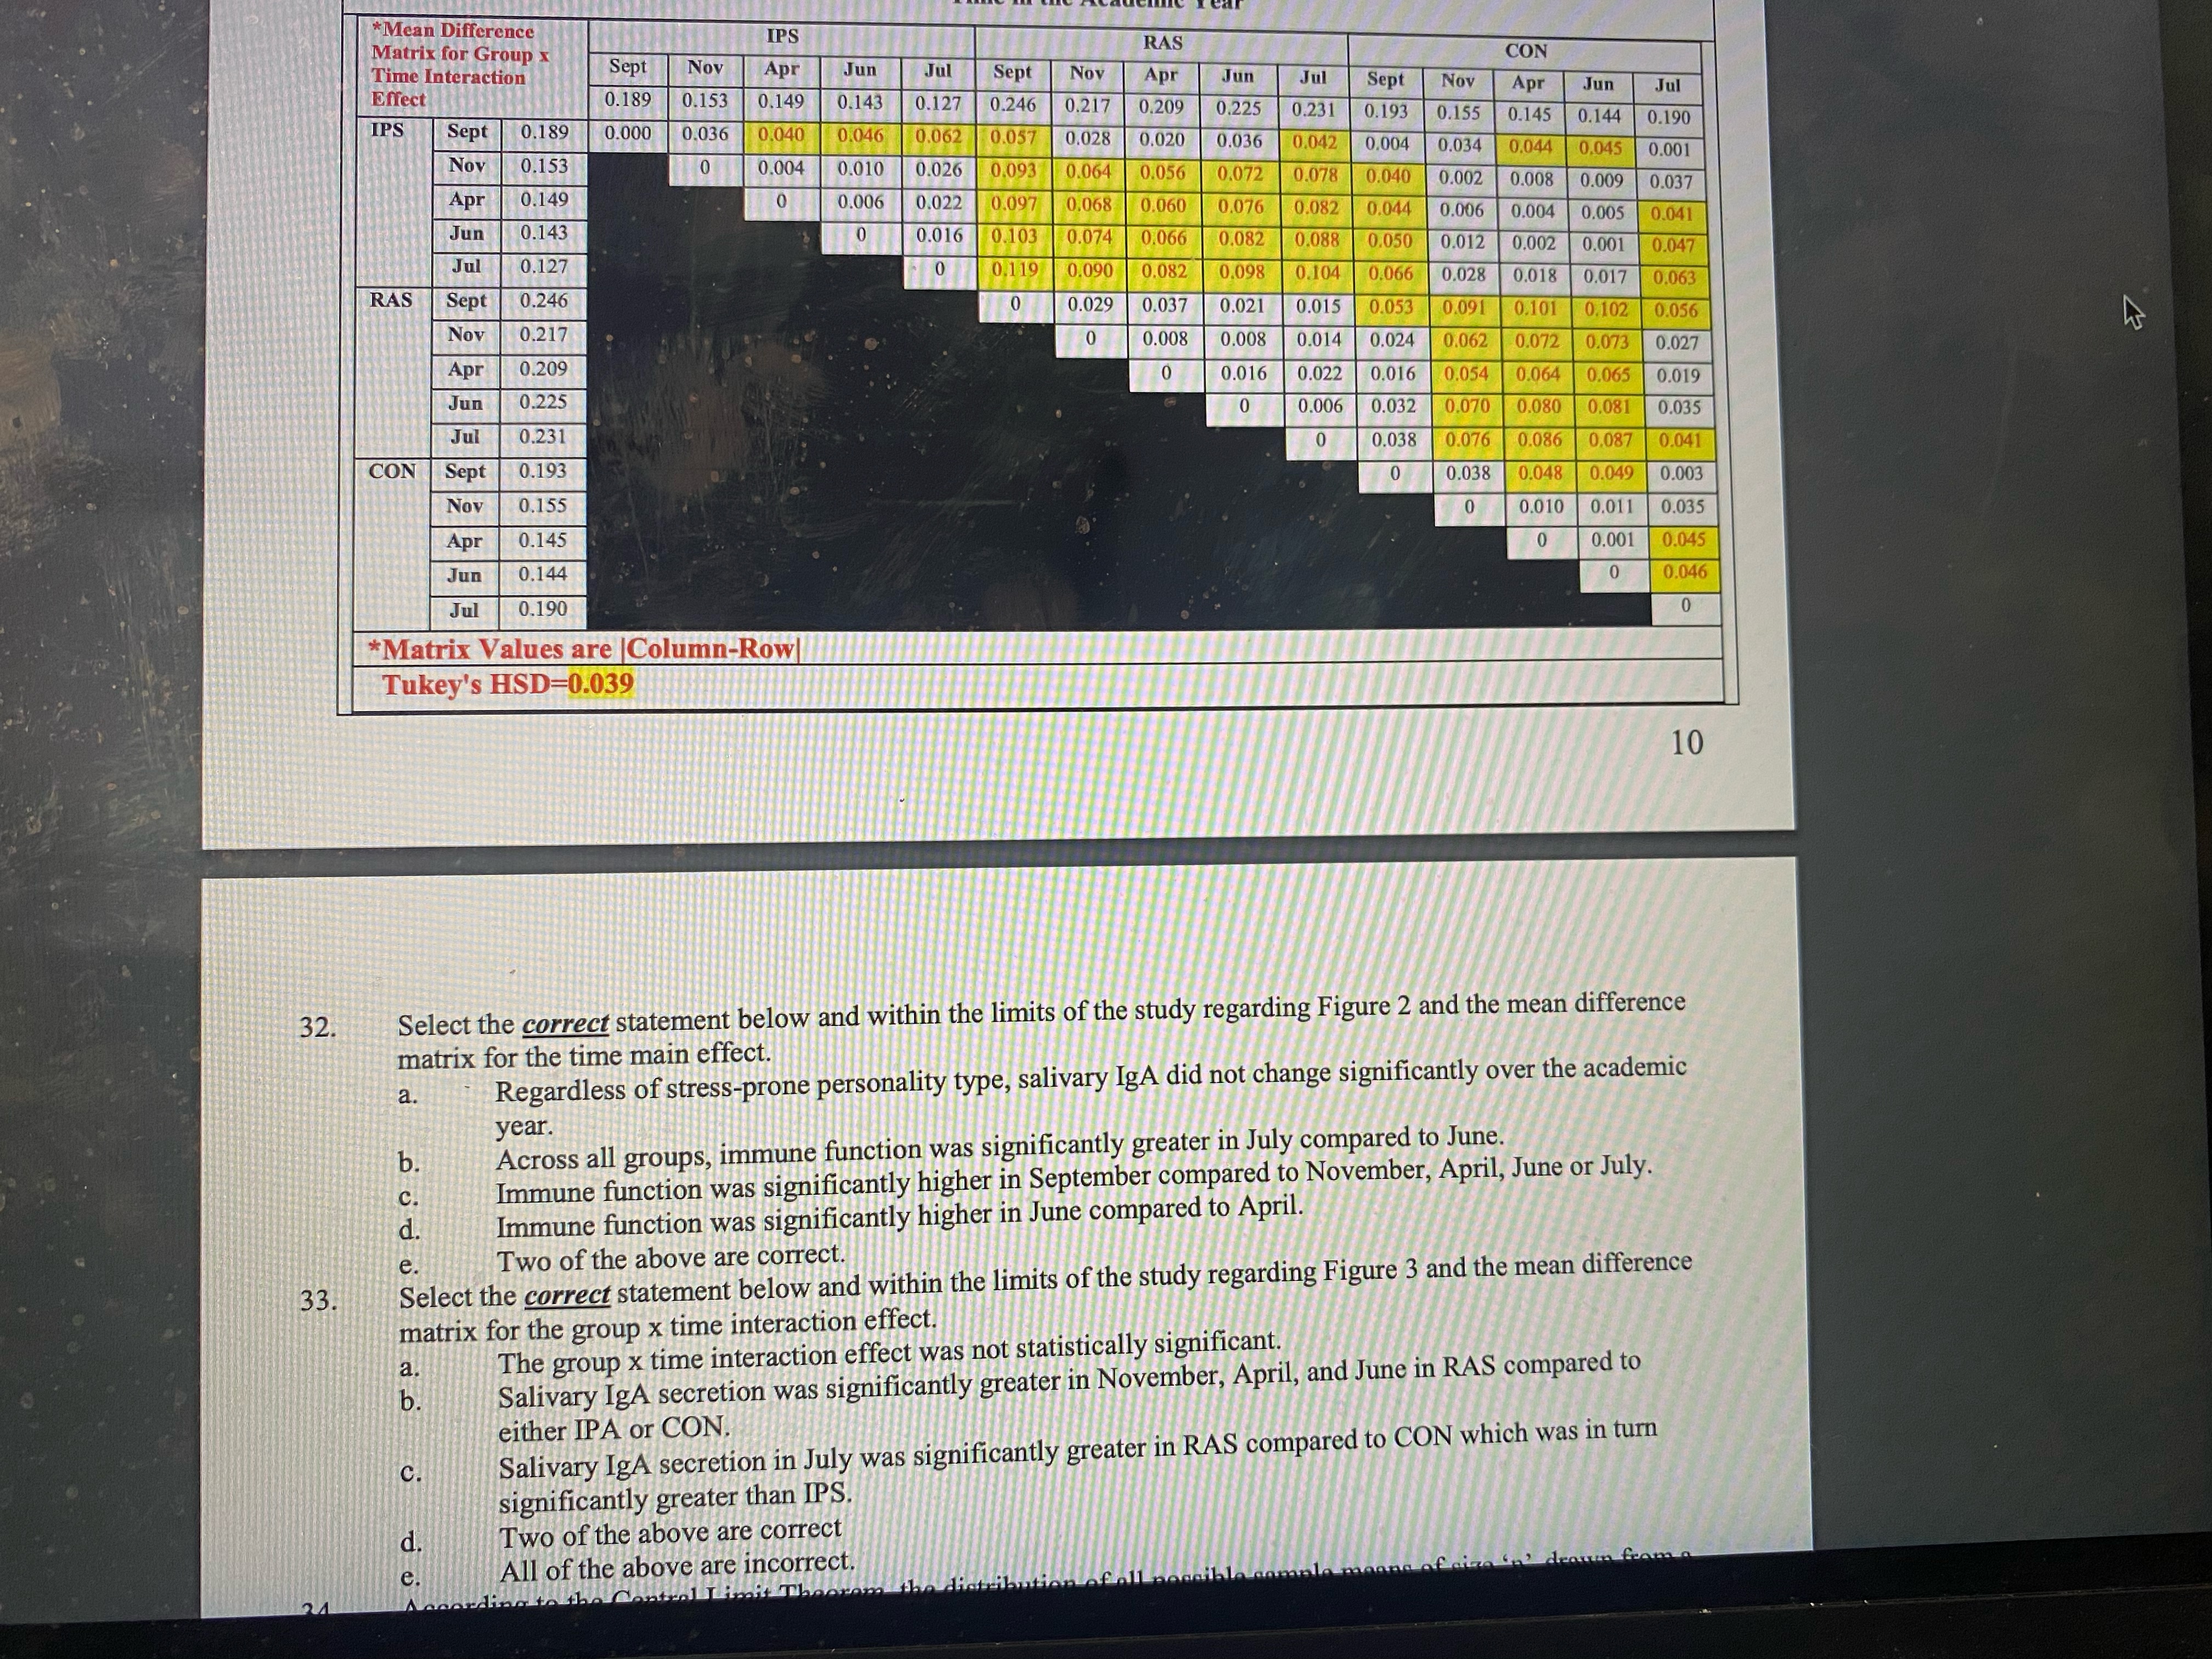
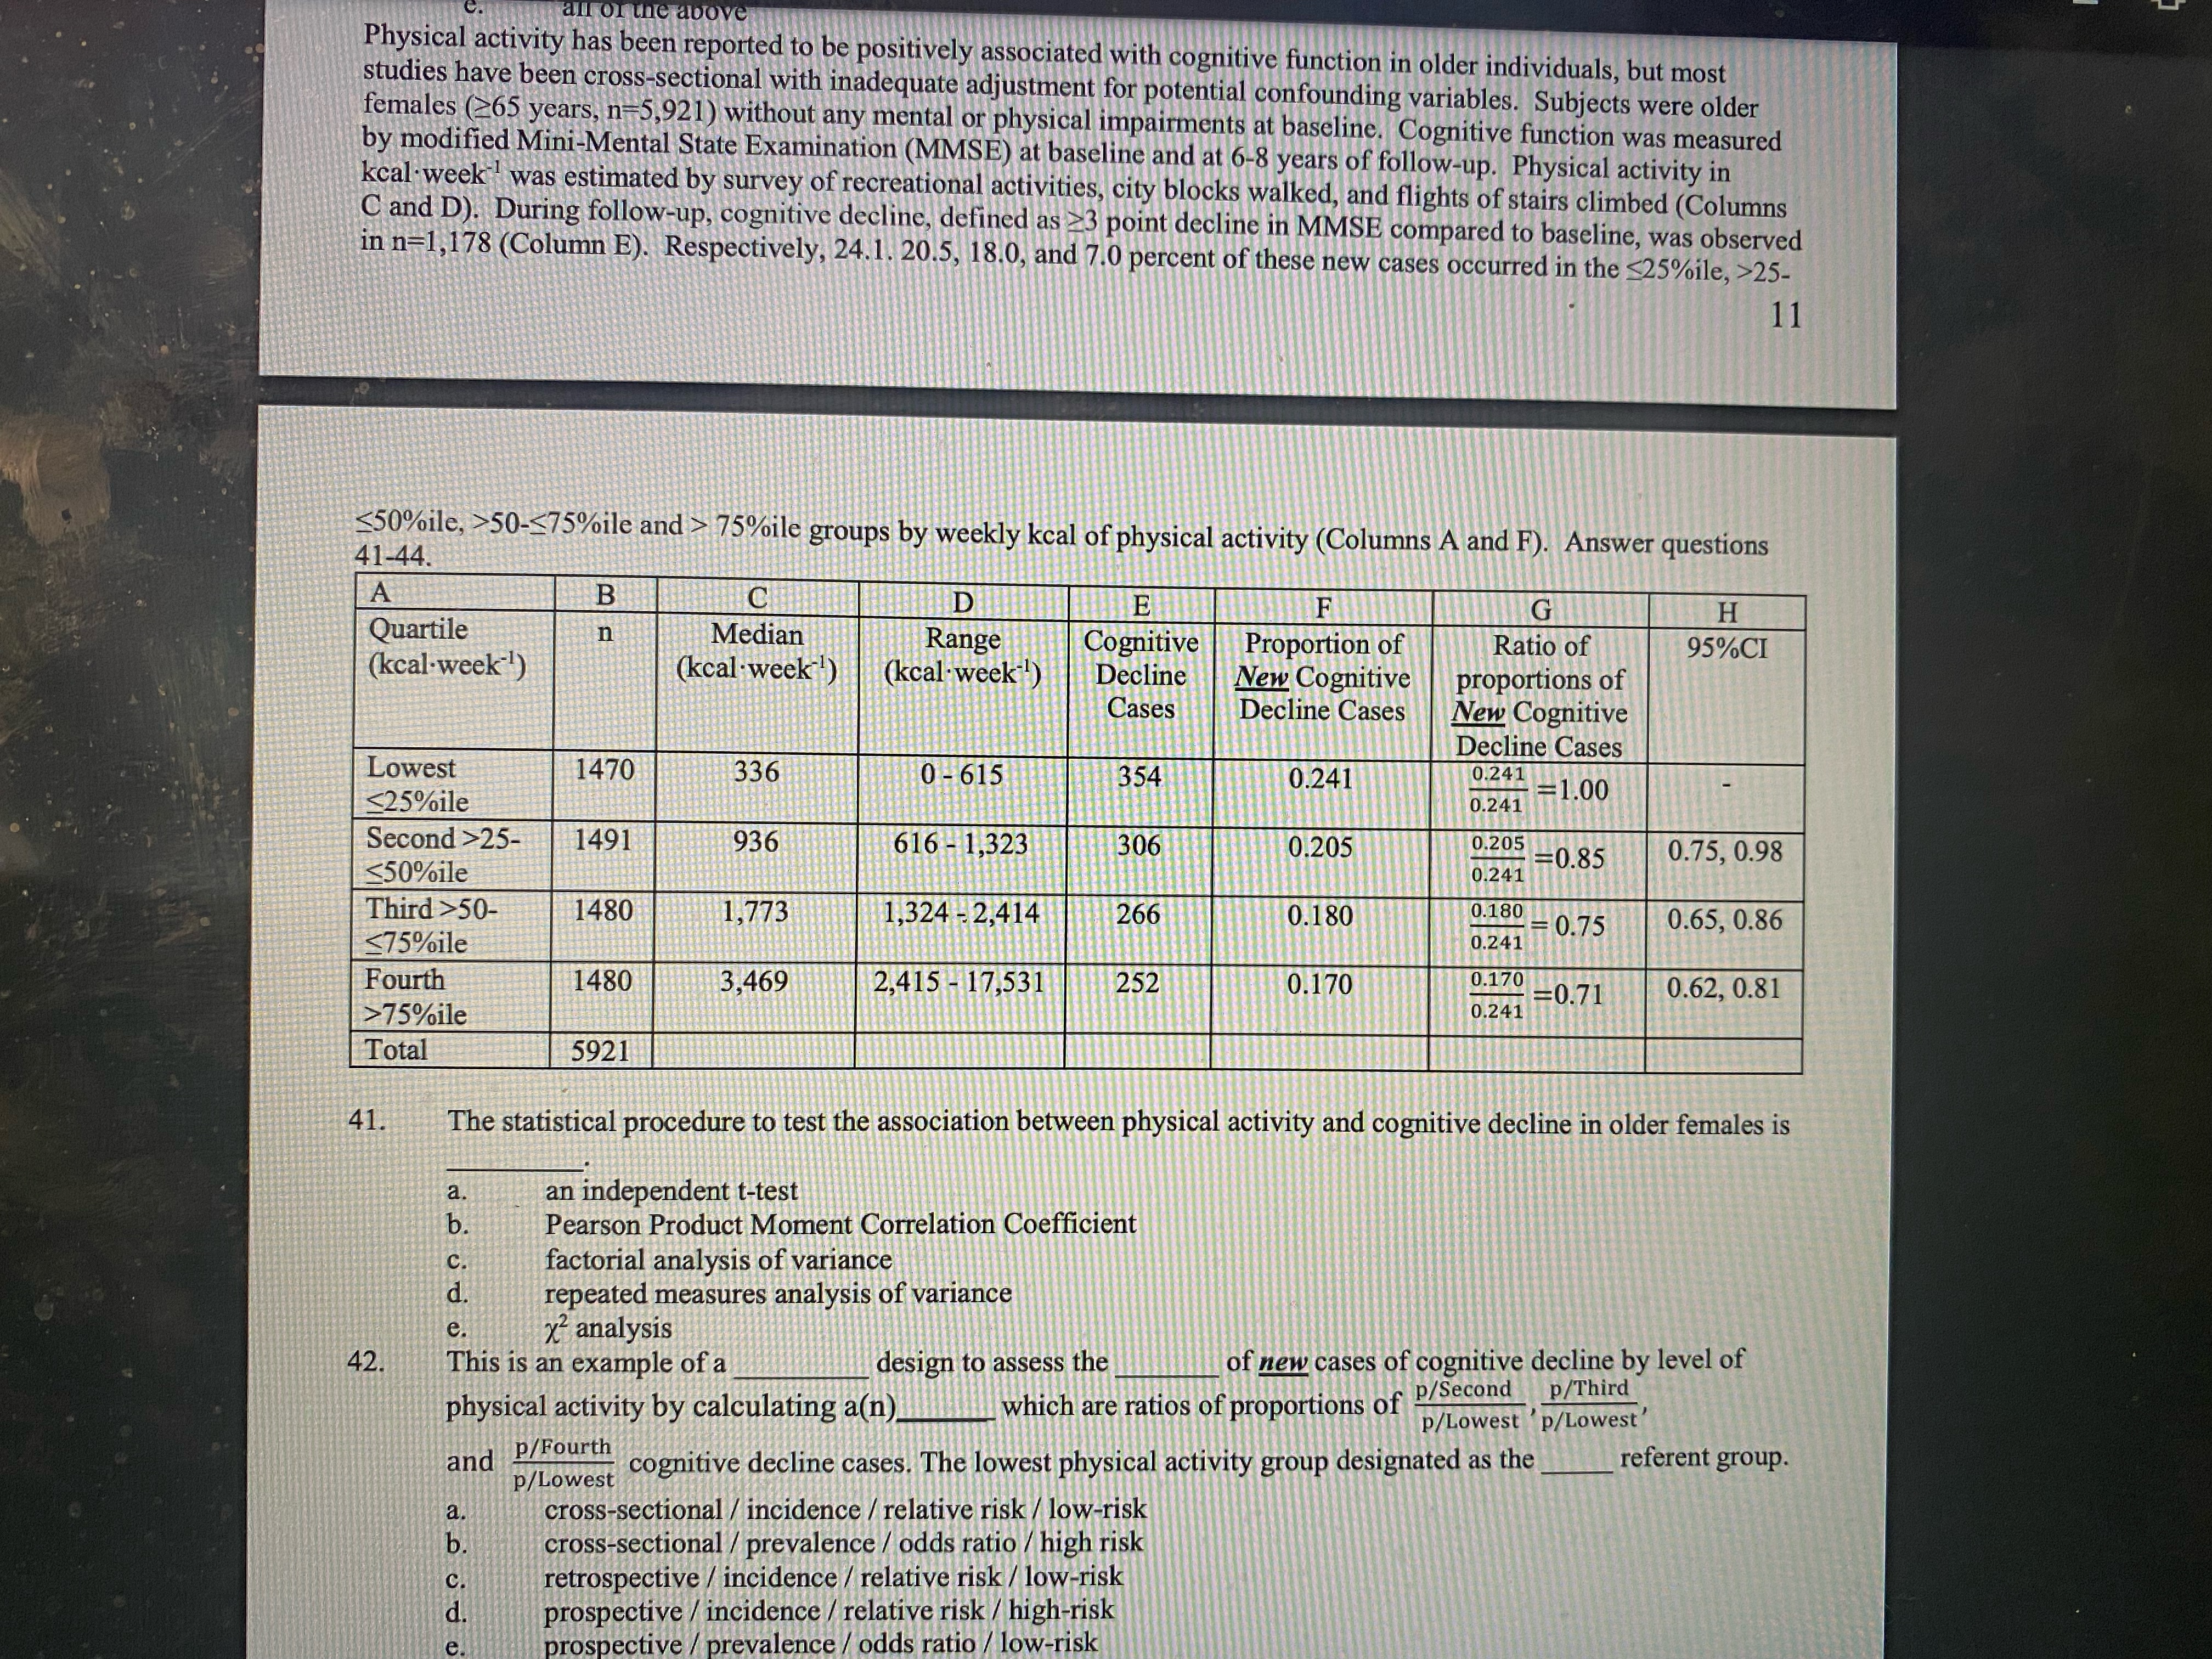
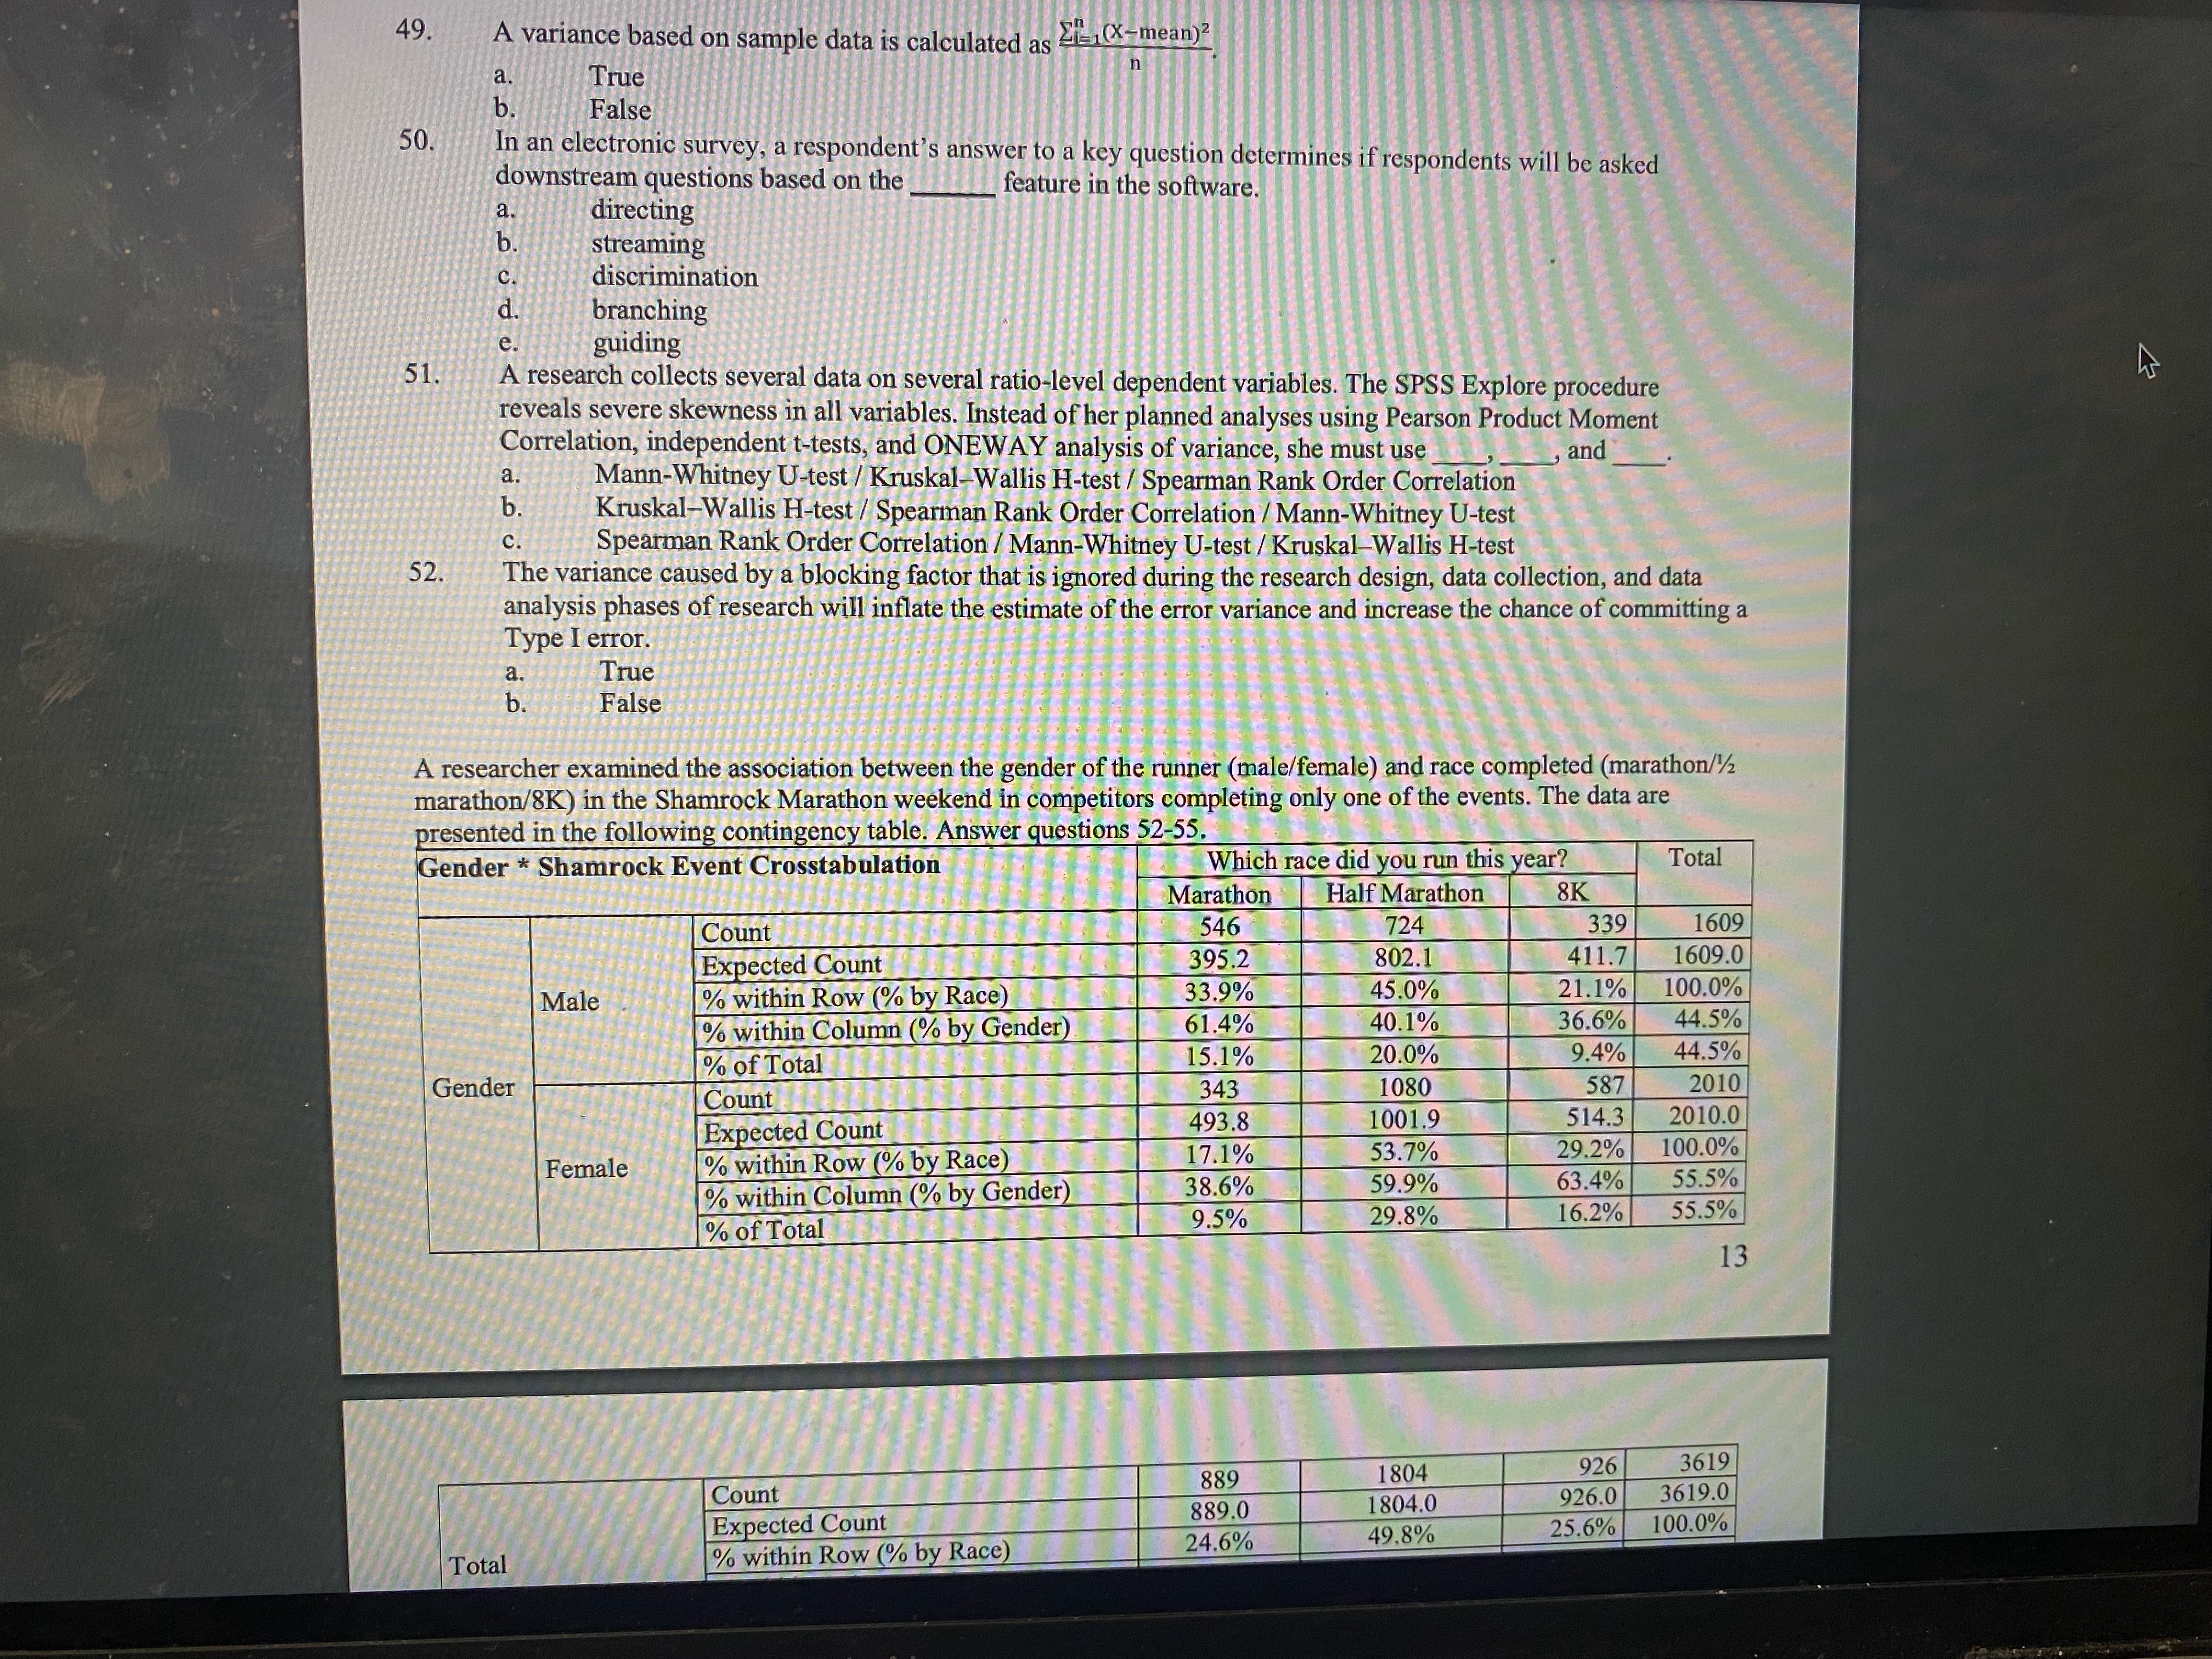
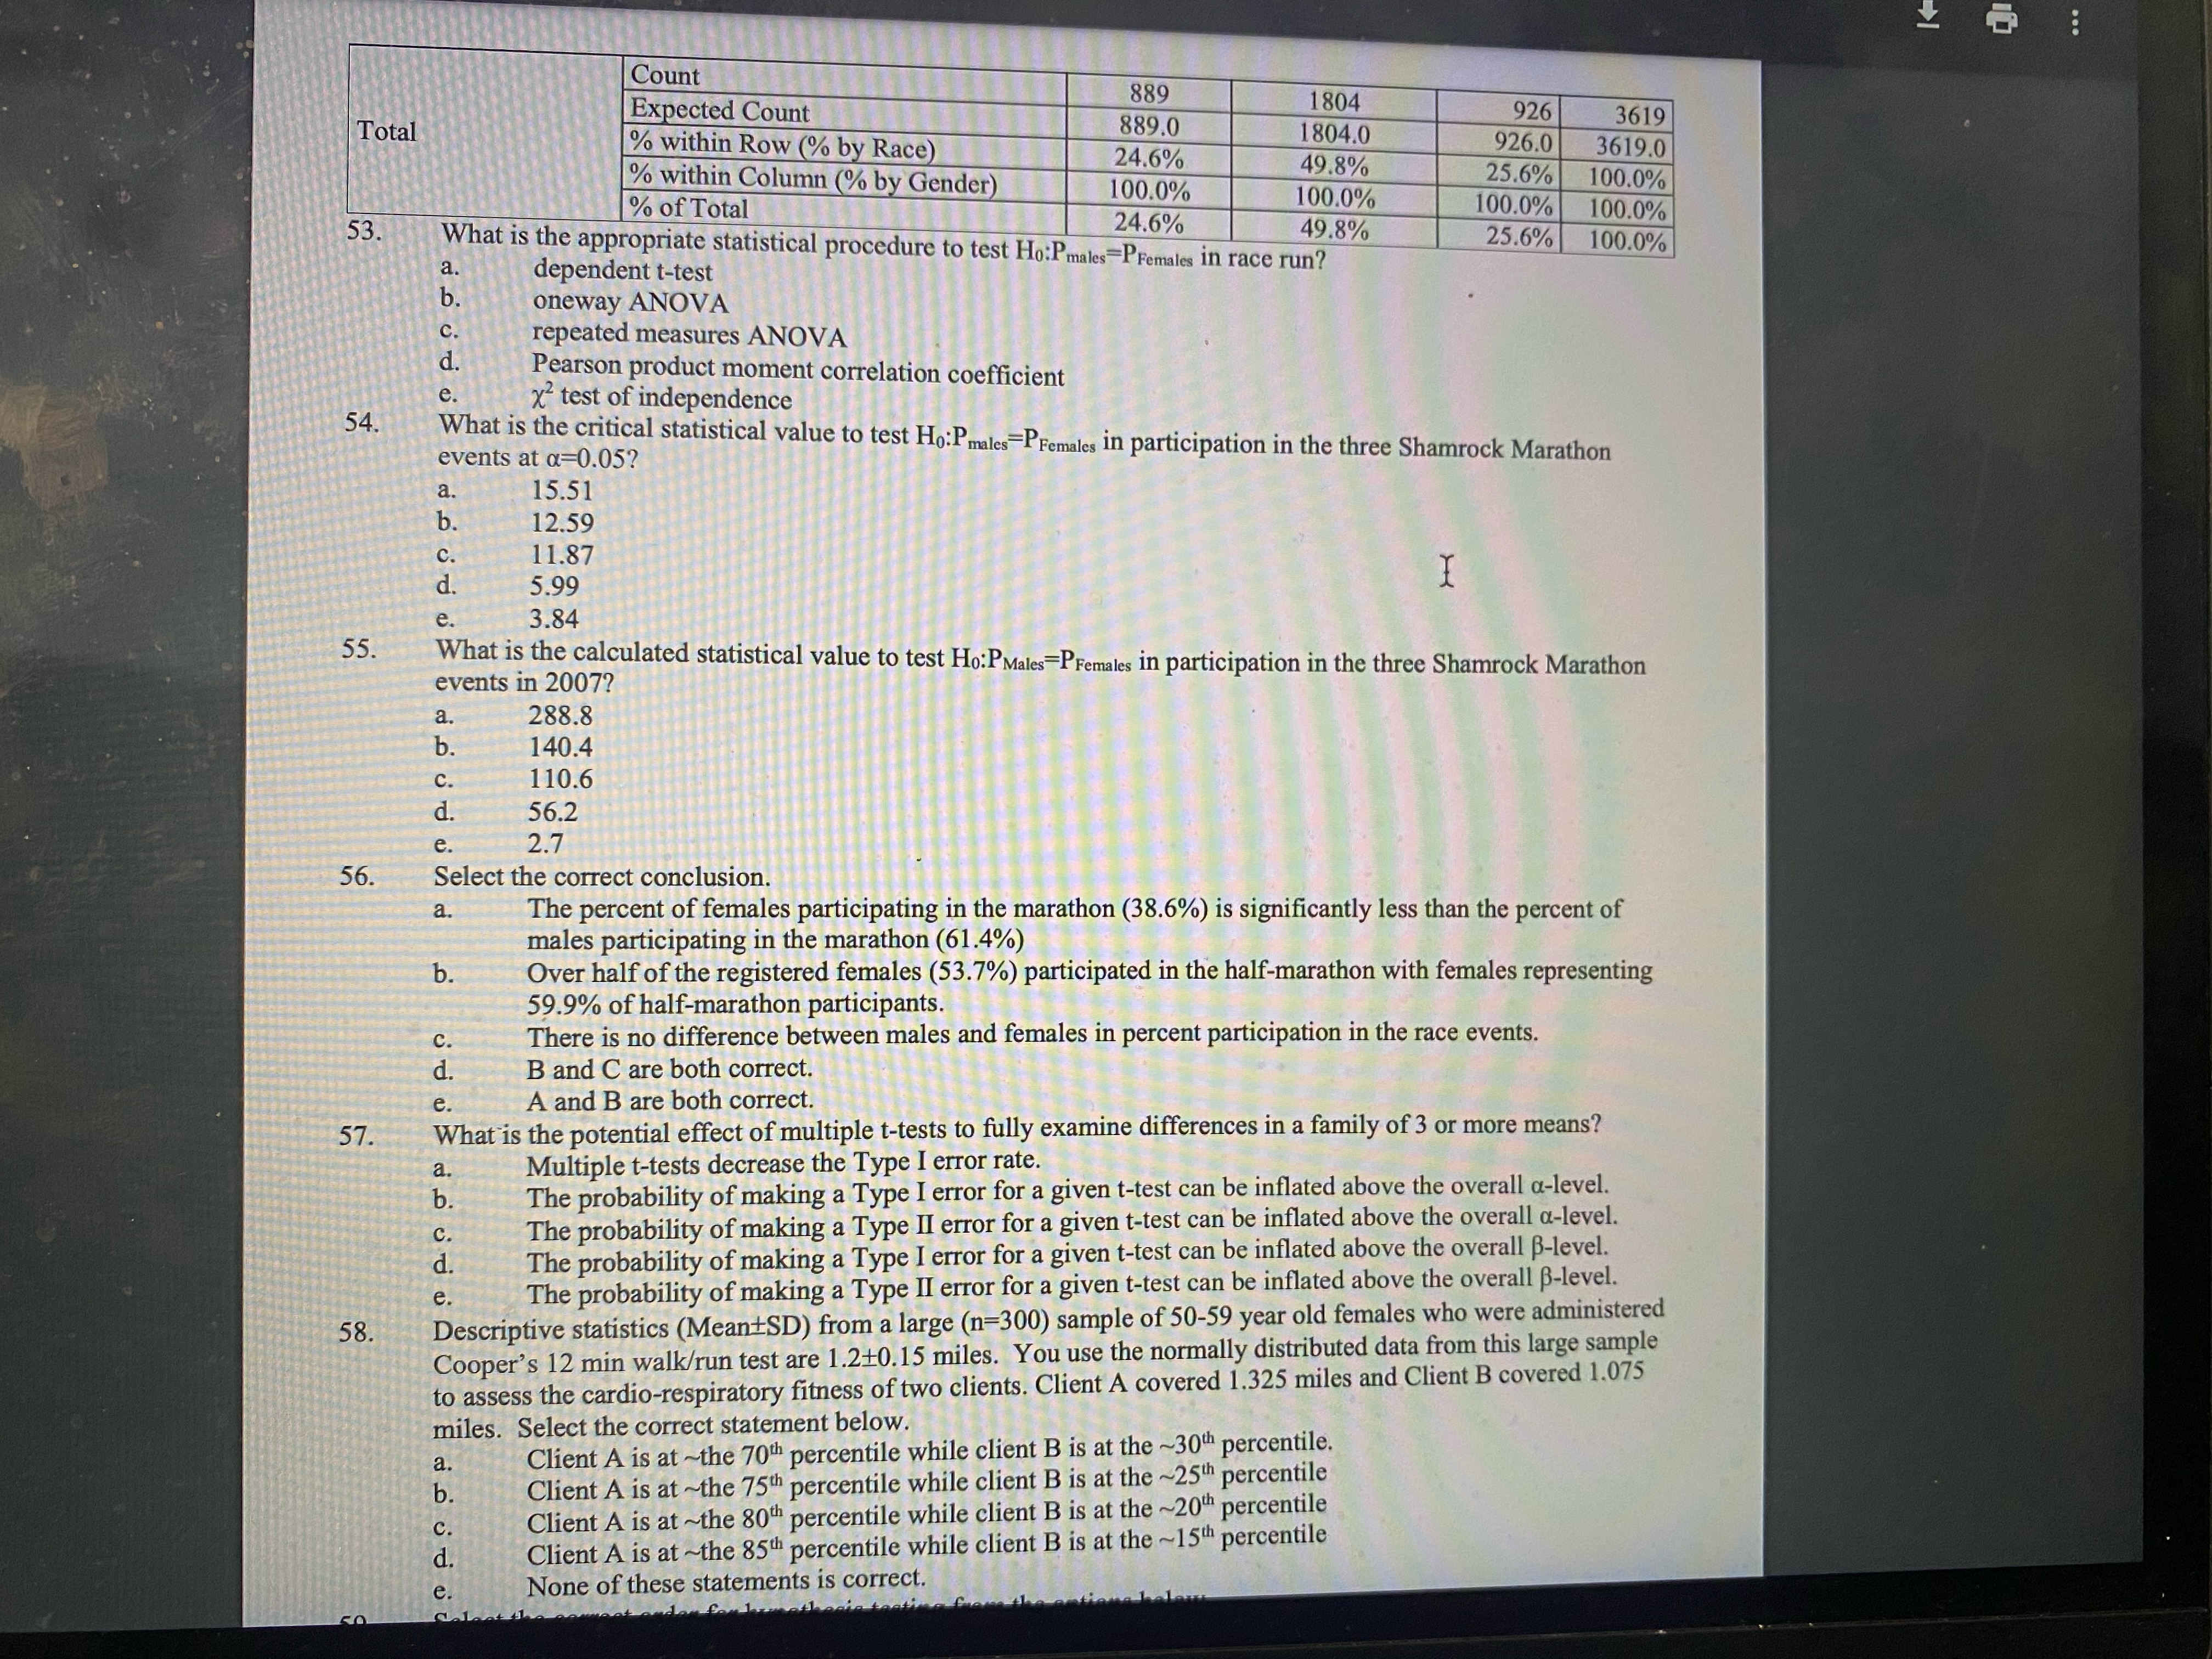
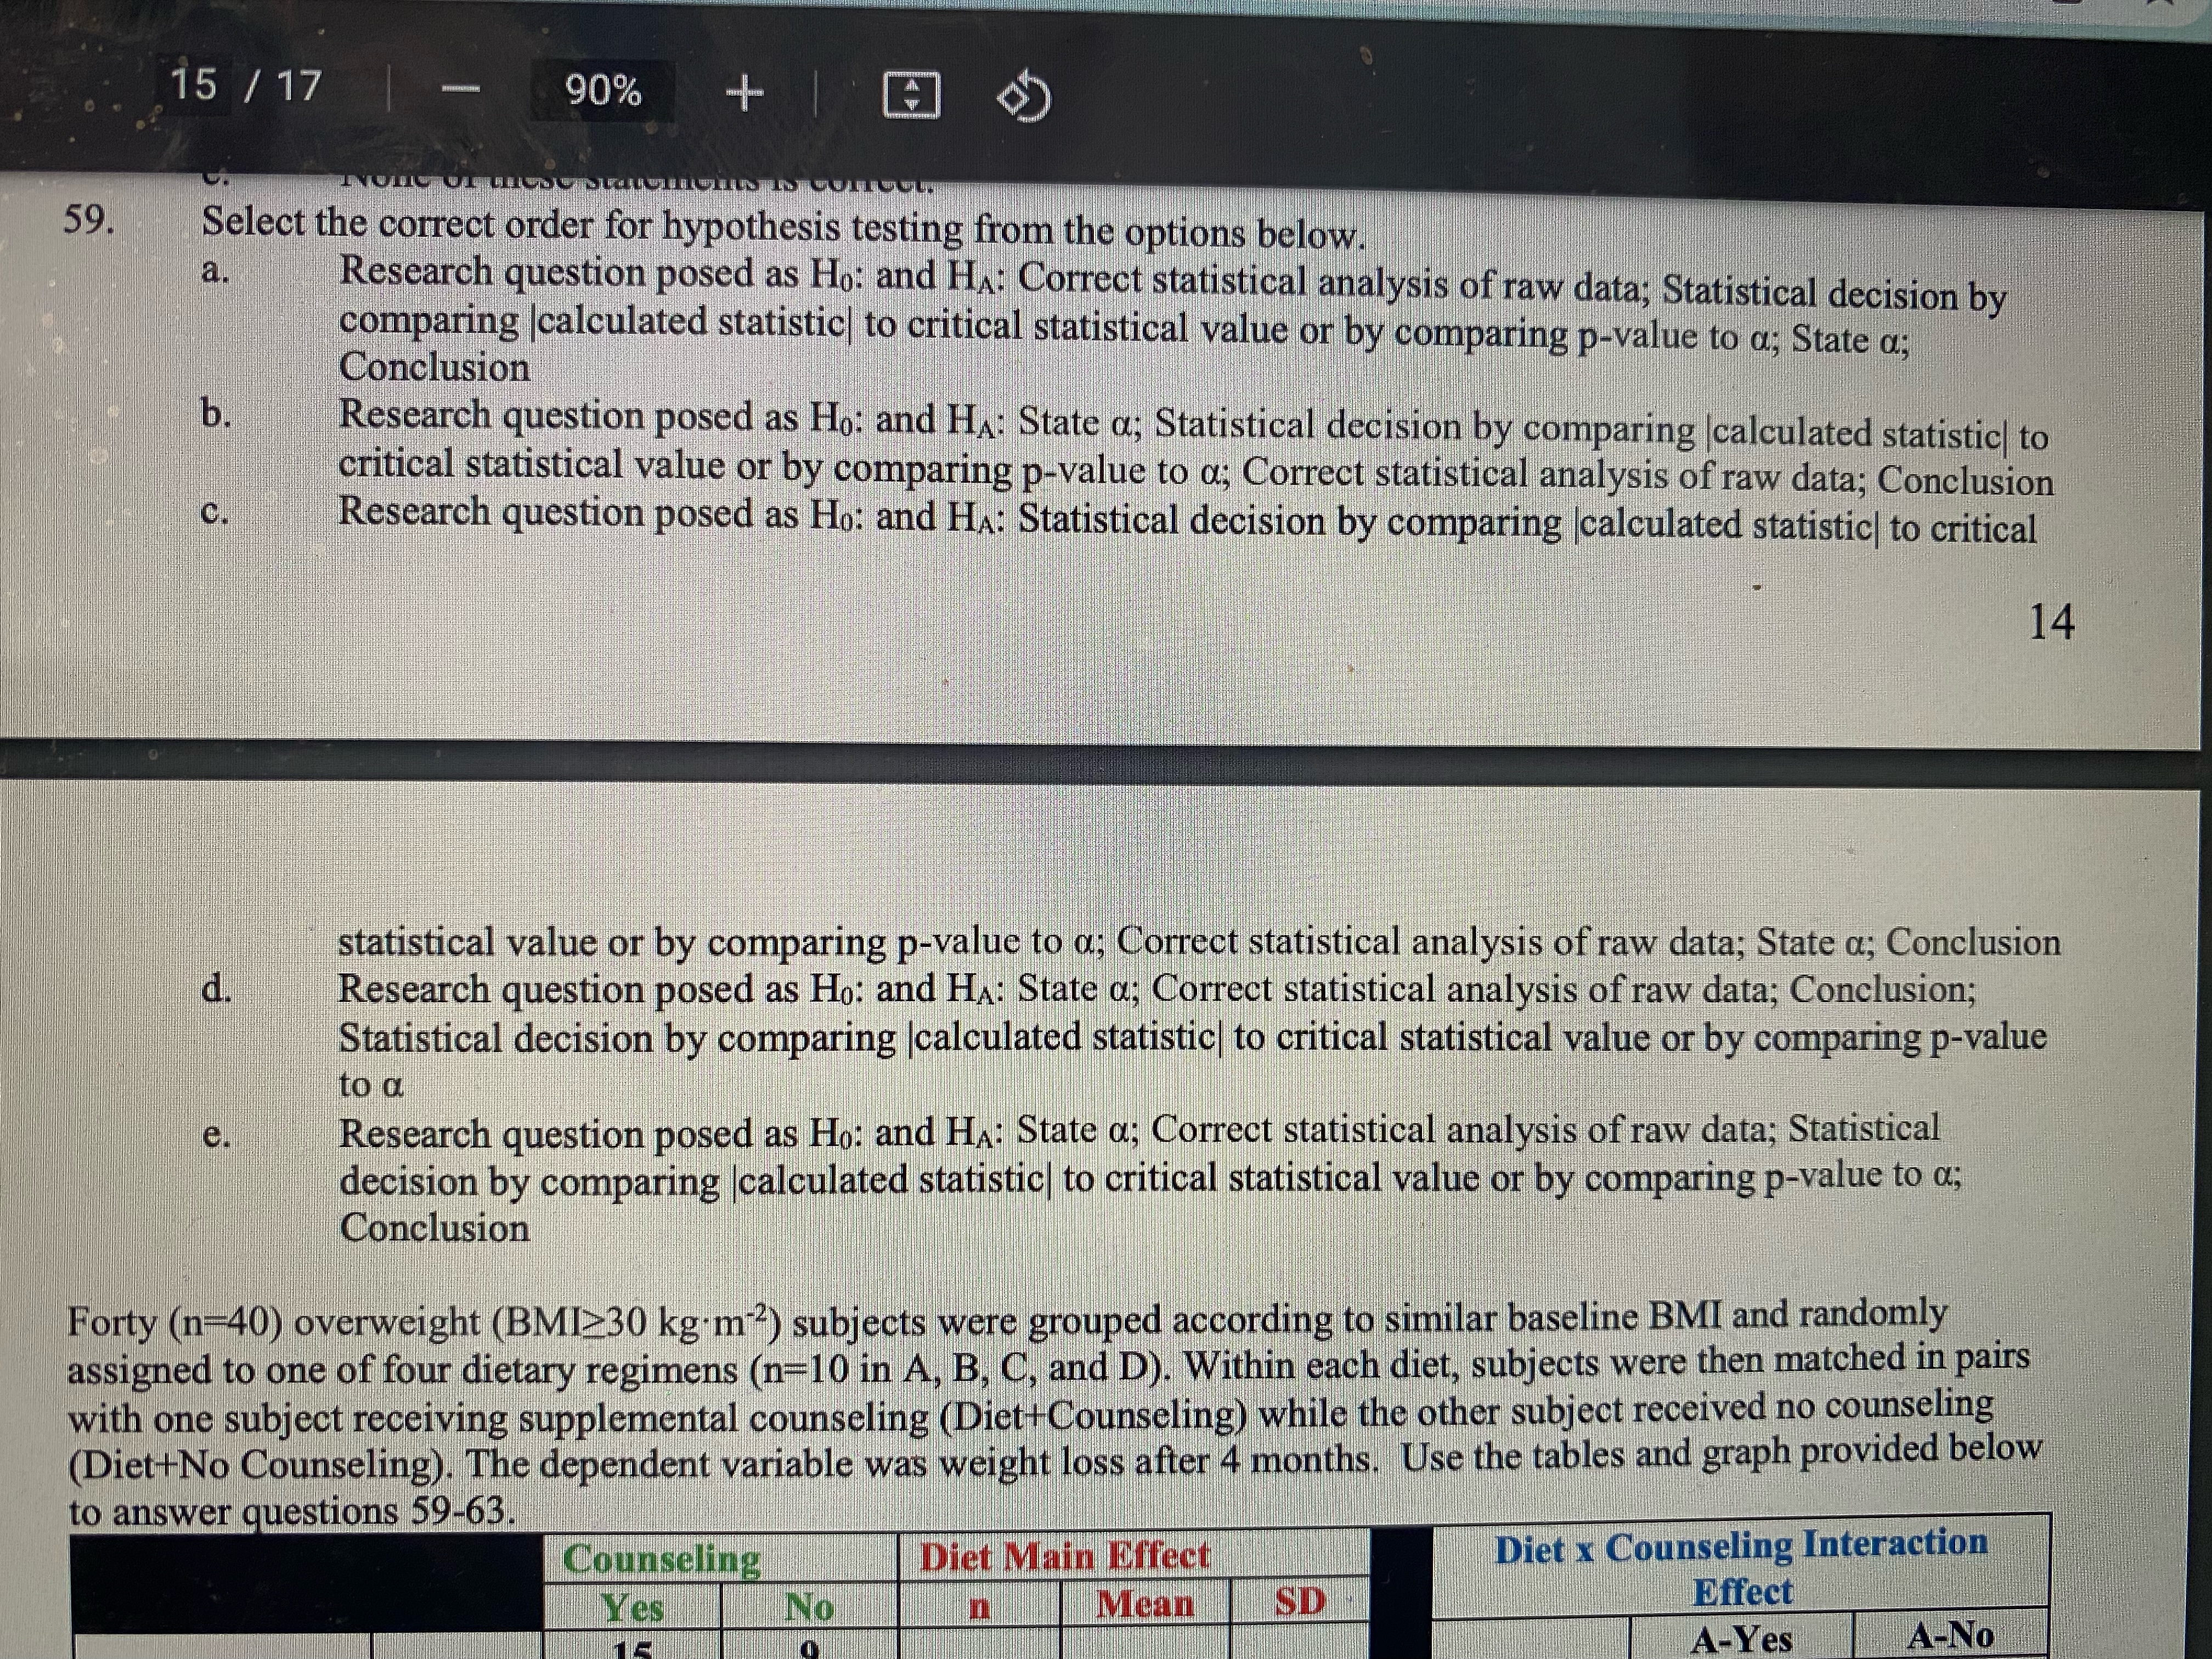
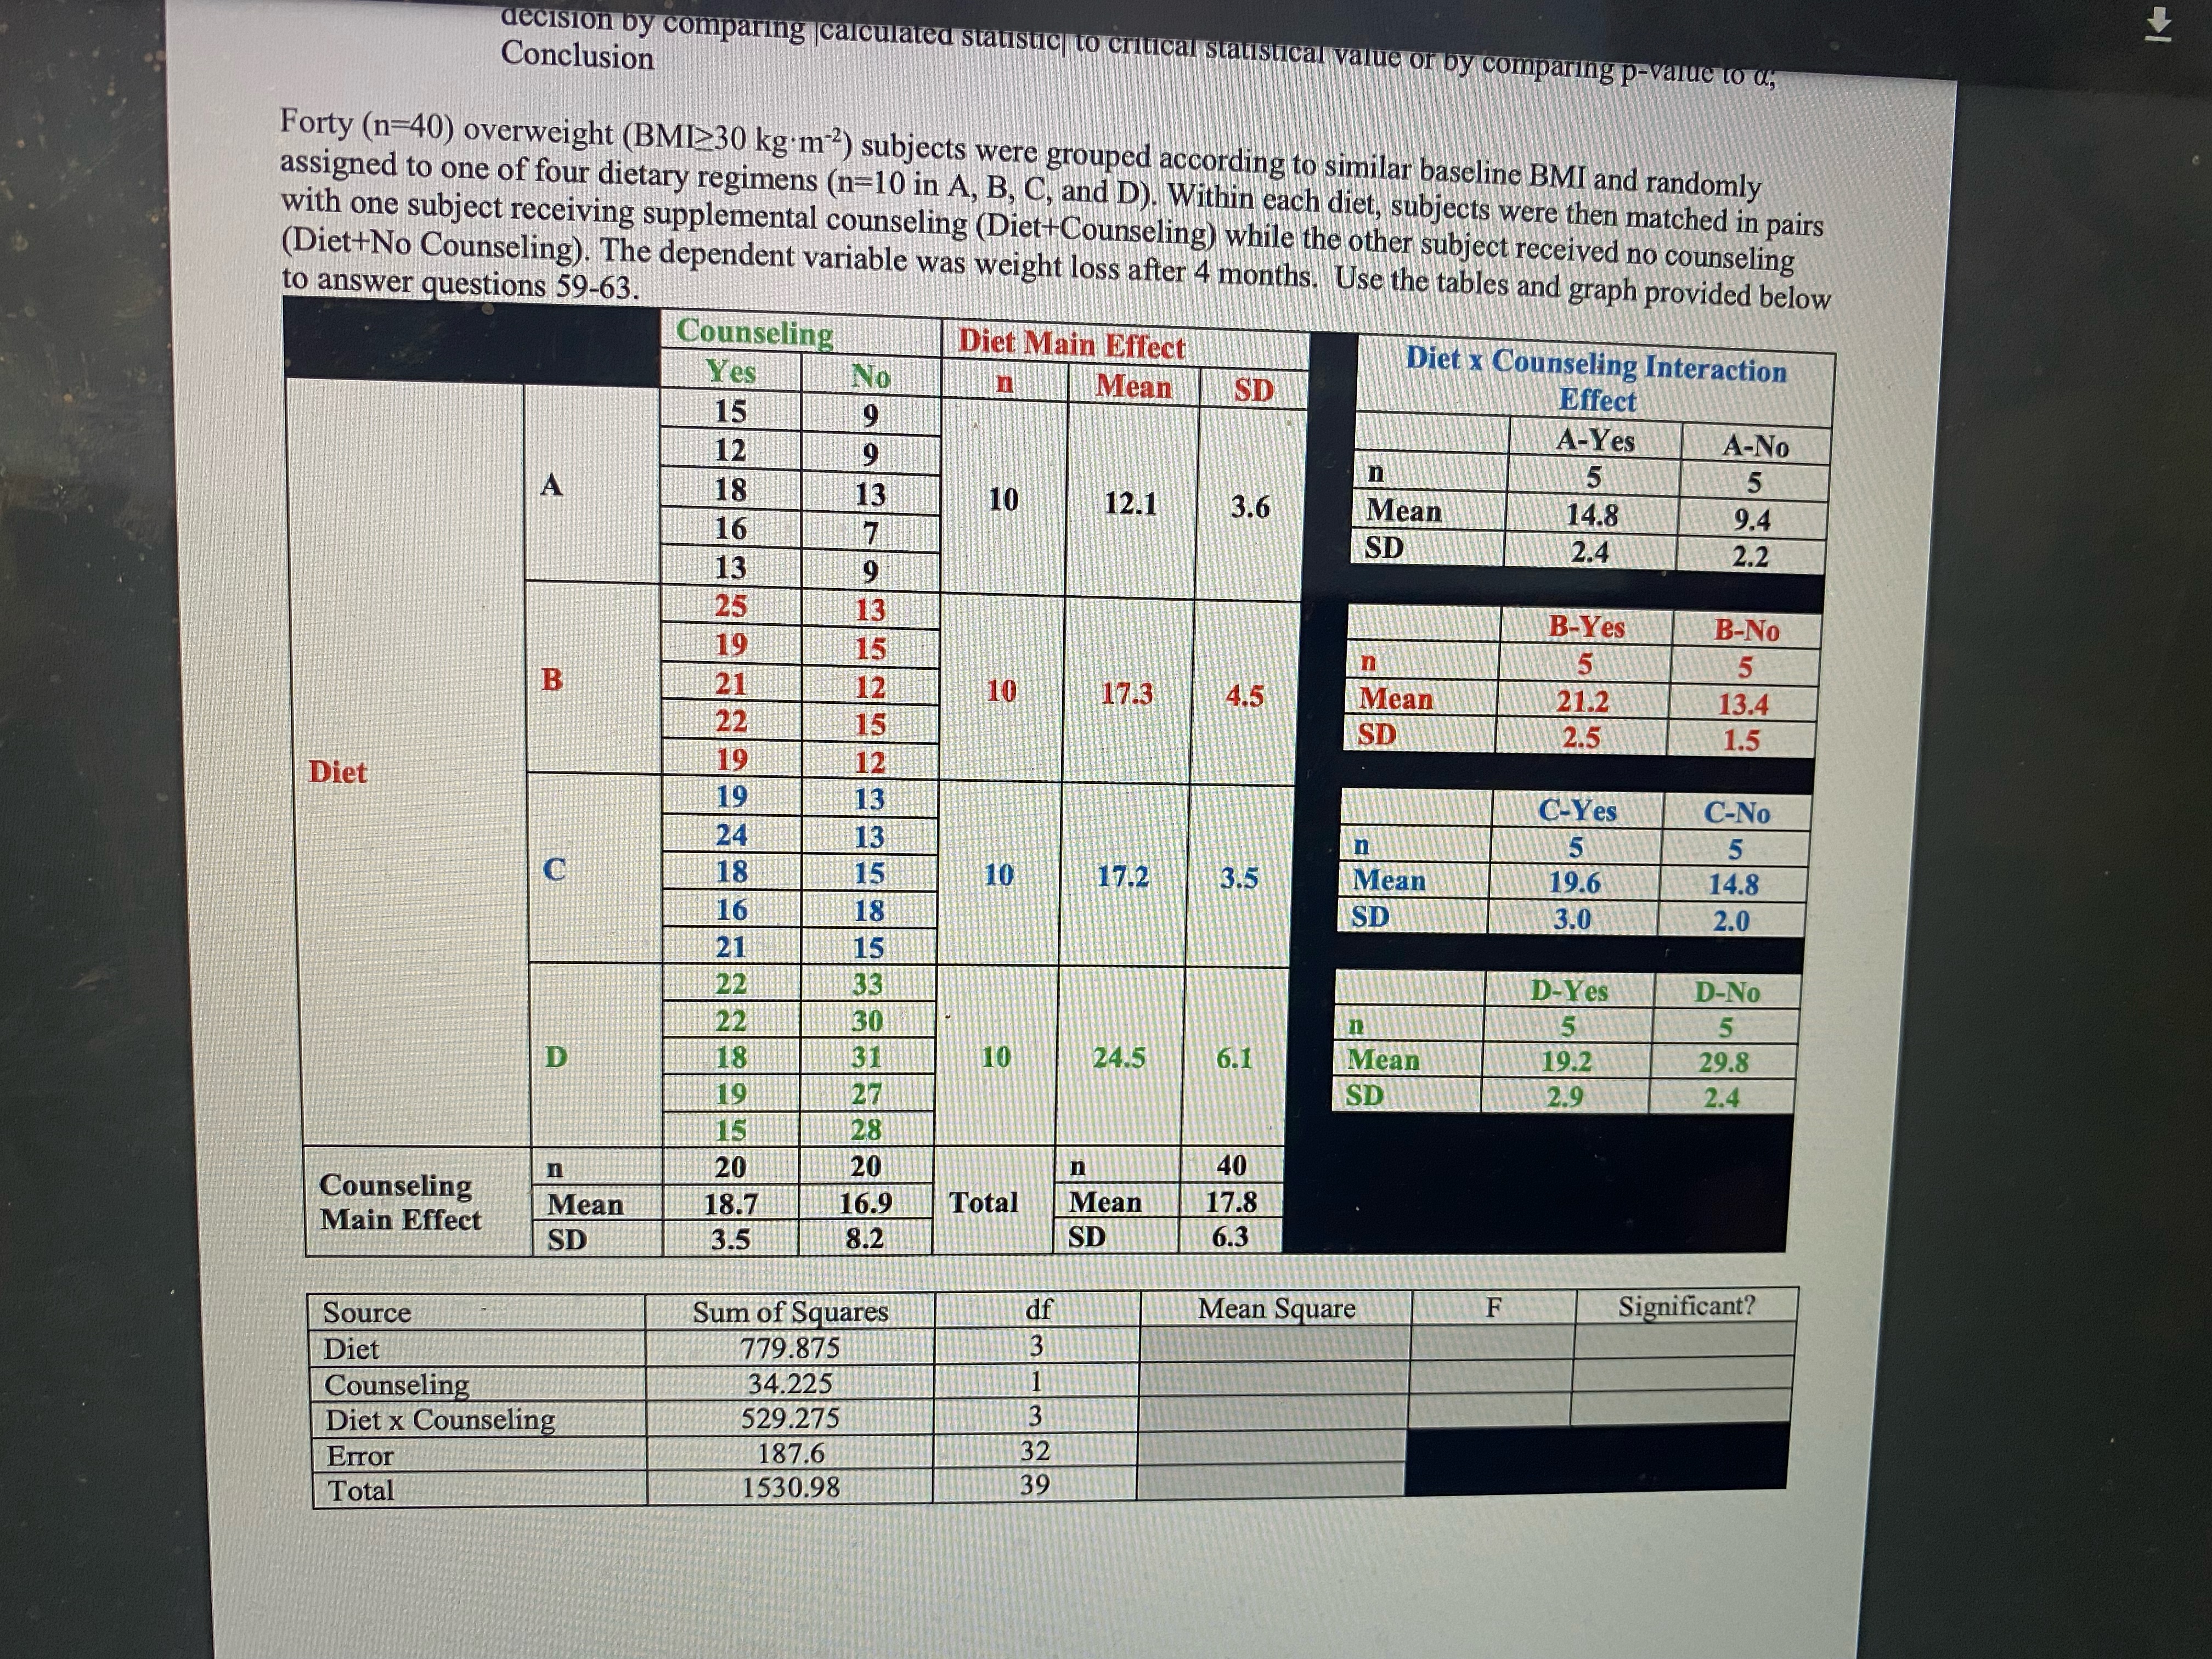
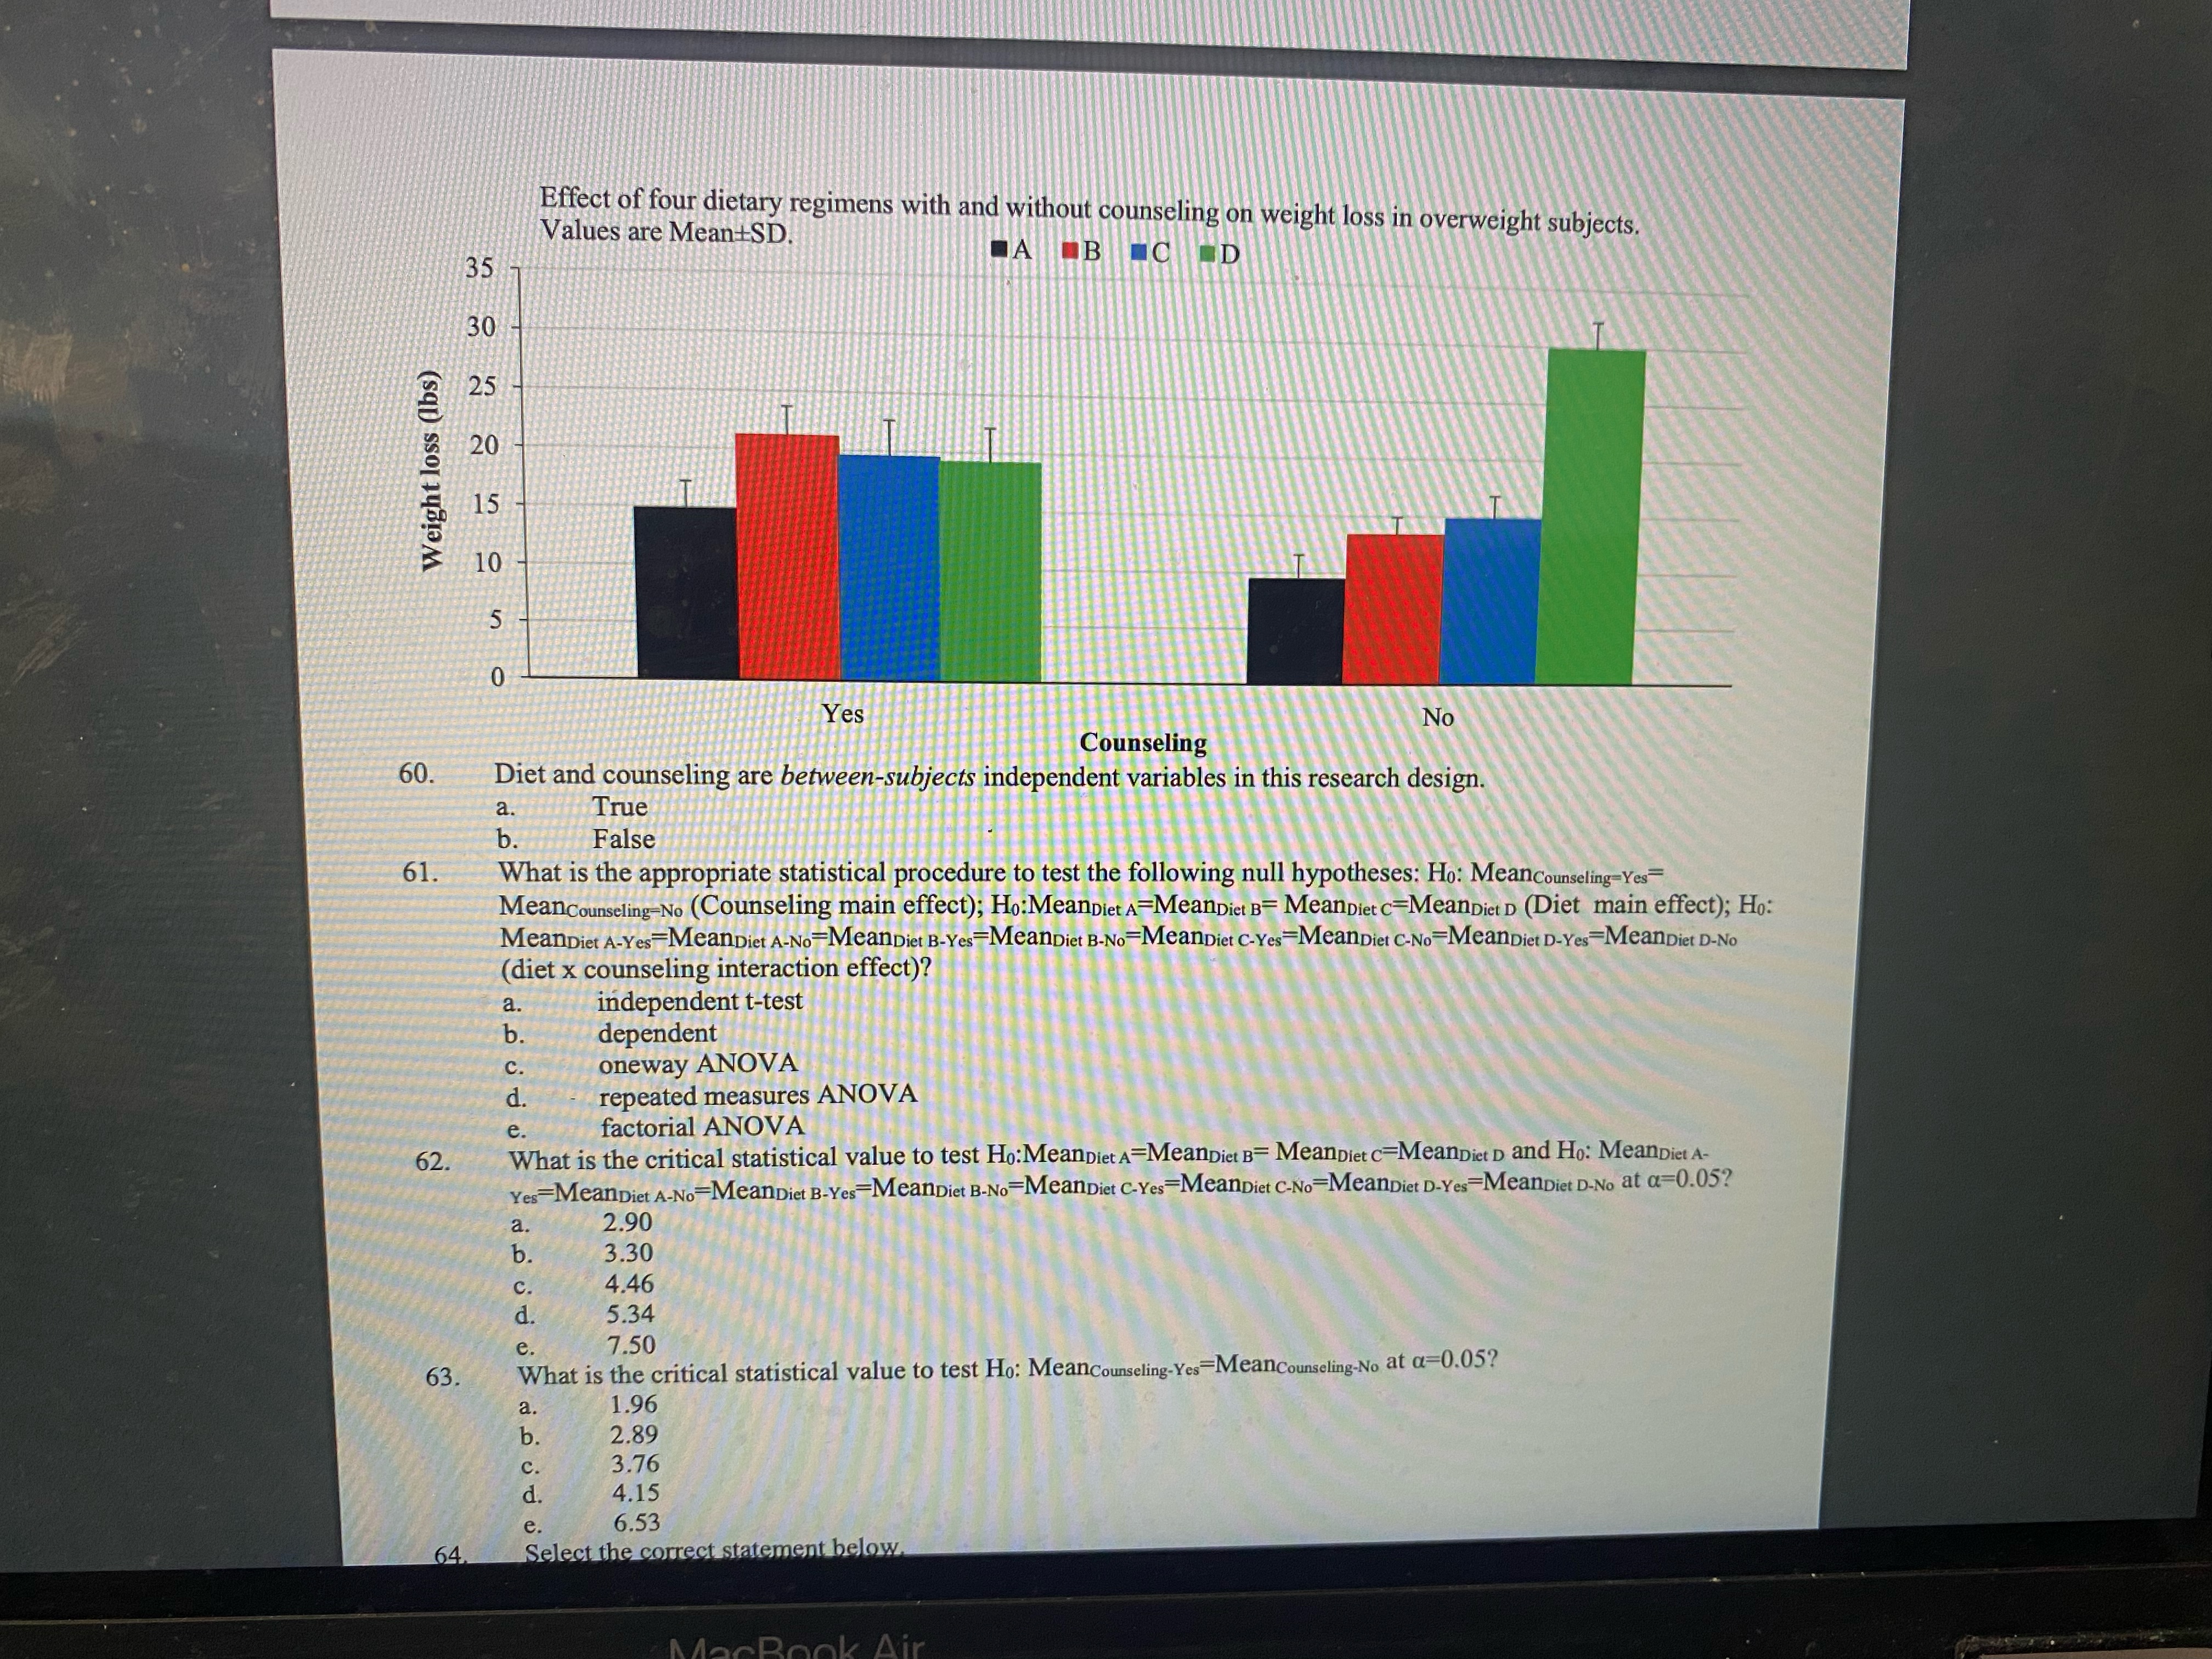
ID Grip Strength (X) (X-Mean)2 98.5 3.4596 Histogram of Grip Strength in male EXSC 415 students $5.5 1.2996 10 95.0 2.6896 98.0 1.8496 126.5 891.6196 90.0 44.0896 114.0 301.3696 108.0 129.0496 124.0 748.5696 87.0 92.9296 Frequency 80.0 276.8896 12 83.0 186.0496 13 57.0 878.5296 14 90.0 44.0896 15 84.0 159.7696 16 93.0 13.2496 17 102.0 28.7296 18 96.0 0.4096 19 97.0 0.1296 20 105.0 69.8896 21 60.0 80.0 100.0 120.0 96.0 0.4096 Sum GS n Mean Tests of Normality Median Kolmogorov-Smirnov Shapiro-Wilk (50%ile) Statistic df P Statistic df P Variance (s2) St Dev (s) GS 161 21 .161 .960 21 .523 95%CL-Lower 95%CI-Upper Grip strength (sum of right and left, kg) was measured in male exercise science majors (n=21). The dataset is presented in the table above along with selected SPSS Explore Procedure descriptive output. Answer questions 1-6. 1. Based on your calculation of the descriptive statistics, the frequency histogram, and the tests of normality, is grip strength normally distributed? a. Yes b No 2. is the mean. a. 93.64 b. 94.64 C . 95.64 96.64 MacBook Air4. is the standard deviation (s) calculated to the nearest 0.5 kg. 12.0 13.0 o poop 13.5 14.0 14.5 5. is the most appropriate measure for reporting grip strength central tendency. a. mean median C. mode 6. The 95% Confidence Interval around the sample mean calculated to the nearest 0.1 kg is 82.6, 110.6 87.8, 101.5 90.3, 103.0 93.6, 99.7 e. The 95% CI cannot be computed 7. A Likert scale is an example of a(n) level variable. A delta score (A, Post-Pre) is an example of a(n level variable. VO2 is an example of a(n) level variable a. nominal / ratio / interval ordinal / ratio / interval interval / ratio / ordinal ratio / ordinal / interval e. ordinal / interval / ratio 8. is a non-parametric procedure. Dependent t-test x analysis Analysis of variance Independent t-test Regression 9 is a parameter estimate. a. 62 e. 10. In the Z distribution, % of the total values would be found within approximately two standard deviations of the mean. a. 100 99 C . 95 68 Spectrophotometry, the measurement of light absorbance by a solute in solution, is an important assay technique in clinical chemistry. According to the Lambert-Beer Law, every solute in solution has an optimal wavelength of maximalSpectrophotometry, the measurement of light absorbance by a solute in solution, is an important assay technique in clinical chemistry. According to the Lambert-Beer Law, every solute in solution has an optimal wavelength of maximal absorbance of the light energy at that wavelength. This property is explained by the Molar Extinction Coefficient (E, which describes the chemical nature of the solution), the concentration of the solute (C), and the length of the light path L, usually 1 cm). The Lambert-Beer Law is quantified in the following equation: Absorbance=E.C.L. Drabkin's reagent, a solution containing 12 mmol liter" NaHCO3, 0.77 mmol liter" KCN and 0.88 mmol . liter KaFe(CN)6, is used to assay the concentration of hemoglobin ([Hb]) in whole blood. The light absorbance at 540 nm (ABS540) is proportional to the concentration of cyanmethemoglobin ([CyanmetHb]), which is in turn directly proportional to [Hb]. Preparation of a new Drabkin's solution requires the running of a "standard curve" to determine the relationship between ABS540 and known concentrations of [Hb], known as "standards." The data in the table below are ABS540 mean of triplicate measures of standard samples (X) containing standard [Hb] concentrations of 0, 3, 6, 9, 12, 15 and 18 grams. 100 ml blood ! (Y). Twenty (20) ul of well mixed whole blood is suspended in 5 ml of Drabkin's reagent. The 2 erythrocytes (red blood cells) are hemolyzed by the Drabkin's reagent with the resulting formation of a cyanmethemoglobin compound that optimally absorbs light at a wave length of 540 nm. An exercise physiologist has prepared a new Drabkin's reagent solution for Hb determination (prediction) in observing acclimatization in males during 30 days altitude exposure (4,300 m). Answer questions 11-15. Standard Y=[Hb] [CyanmetHb] X=Absorbance at Hb g . 100 ml- ABS 5402 mg. 100 ml- 540 nm (ABS540) Hb . ABS 540 0 0 0 0 0 2 3 0 11.8 0.095 9 0.0090 3 0.285 6 23.9 0.195 36 0.0380 4 9 1.17 36.2 0.285 81 0.0812 5 2.565 12 48.1 0.395 144 0.1560 6 4.74 15 59.8 0.485 225 0.2352 7 1.275 18 72.5 0.605 324 0.3660 10.89 63 252.3 2.06 819 1.8856 26.9250 7 7 7 Mean 9 36.042857 0.2942857 S 6.4807407 26.054997 0.2157628 11. What statistical procedure is used to predict or determine the [Hb] in known blood samples based on the strong association between [Hb] and ABS540? a. dependent t-test b. multiple linear regression simple linear regression d. repeated measures ANOVA e. Pearson product moment correlation coefficient12. Select the correct statement. a. The coefficient of determination is the proportion of error variance. 1-r is the common or shared variance. 99.9% of the variance in [Hb] is explained by ABS540 in the standard curve for this cyanmethemoglobin solution 13. Select the correct option below regarding hemoglobin concentration [Hb] and ABS$40- a. [Hb] = 8.732 + (0.030 .ABS540) b. [Hb] = -0.002 + (8.734.ABS$40) [Hb] = -0.069 + (33.521.ABS 540) [Hb] -0.166 + (30.02-ABS540) There is insufficient information to determine [Hb] from ABS$40. 14. [Hb] was assayed as 15.5+1.0 g-100 ml" (n=15, Meants) at sea level. After 30 days at 4,300 m, the mean for ABS540 in 20 ml blood samples was 0.555. The post-acclimatization mean [Hb] in the subjects was g.100 ml" which is consistent with the well-documented in plasma volume early in acclimatization followed by a(n) in erythrocyte (red blood cell) production reflecting later in acclimatization. a. 16.8 / increase / decrease / anemia b. 13.8 / increase / increase / anemia C . 16.8 / decrease / increase / polycythemia 13.8 / decrease / decrease / polycythemia e. 16.8 / increase / increase / anemia 15. Standard, control, and unknown samples assayed for [Hb] in triplicate generate data on methodological as analyzed by a. validity / Pearson Product Moment Correlation b. reliability / Pearson Product Moment Correlation C. objectivity / intraclass correlation coefficient d. reliability / intraclass correlation coefficient e . reliability / repeated measures ANOVA An exercise physiologist measured VO2max (ml min"), mass (kg), height (m), age (years), exercise frequency (days .week ") and exercise intensity (6-20 Borg RPE) in females (n=39). Descriptive summary data and other SPSS output areAn exercise physiologist measured VO2max (ml.min"), mass (kg), height (m), age (years), exercise frequency (days . week 1) and exercise intensity (6-20 Borg RPE) in females (n=39). Descriptive summary data and other SPSS output are presented below. Answer questions 16-17. Mean s n Correlations VO2max 2600 334 39 VO2max Mass Ht Age Frequency Intensity Mass 50.0 6.7 39 VO2max 0.933 0.096 0.902 0.338 0.960 Height 1.70 0.06 39 P 25-all of the above Physical activity has been reported to be positively associated with cognitive function in older individuals, but most studies have been cross-sectional with inadequate adjustment for potential confounding variables. Subjects were older females (265 years, n-5,921) without any mental or physical impairments at baseline. Cognitive function was measured by modified Mini-Mental State Examination (MMSE) at baseline and at 6-8 years of follow-up. Physical activity in kcal week was estimated by survey of recreational activities, city blocks walked, and flights of stairs climbed (Columns C and D). During follow-up, cognitive decline, defined as 23 point decline in MMSE compared to baseline, was observed in n=1,178 (Column E). Respectively, 24.1. 20.5, 18.0, and 7.0 percent of these new cases occurred in the $25%ile, >25- 11 41-44. 50- 75%ile groups by weekly kcal of physical activity (Columns A and F). Answer questions A B C D E F Quartile G H n Median Range Cognitive (kcal.week !) Proportion of Ratio of 95%CI (kcal .week !) (kcal week!) Decline New Cognitive proportions of Cases Decline Cases New Cognitive Decline Cases Lowest 1470 336 0 -615 354 0.241 0.241 25- 1491 936 616 - 1,323 306 0.205 0.205 0.75, 0.98 50- 1480 1,773 1,324 - 2,414 266 0.180 0.180 $75%ile = 0.75 0.65, 0.86 0.241 Fourth 1480 3,469 2,415 - 17,531 252 0.170 0.170 0.241 =0.71 0.62, 0.81 >75%ile Total 5921 41. The statistical procedure to test the association between physical activity and cognitive decline in older females is an independent t-test Pearson Product Moment Correlation Coefficient C . factorial analysis of variance d repeated measures analysis of variance e. x analysis 42 This is an example of a design to assess the of new cases of cognitive decline by level of physical activity by calculating a(n). which are ratios of proportions of P/Second p/Third p/Lowest p/Lowest and P/Fourth p/Lowest cognitive decline cases. The lowest physical activity group designated as the referent group. a cross-sectional / incidence / relative risk / low-risk cross-sectional / prevalence / odds ratio / high risk C . retrospective / incidence / relative risk / low-risk prospective / incidence / relative risk / high-risk prospective / prevalence / odds ratio / low-risk43. prospective / prevalence / odds ratio / low-risk Based on the 95% CI in the table above, select the correct answer. a. Compared to the lowest physical activity quartile, only the fourth (highest) quartile had lower cognitive decline in older females. Compared to the lowest physical activity quartile, the third and fourth quartiles had lower cognitive decline in older females. C . Compared to the lowest physical activity quartile, the second, third, and fourth quartiles had lower cognitive decline in older females. d. There is no evidence that higher weekly physical activity is associated with decreased cognitive decline in older females. 44 Suppose the researchers decided to match subjects with cognitive decline with subjects from the same population without cognitive decline and compare histories of exposures to factors (including physical activity) that might affect the different numbers of existing cases in these two groups. The percentage of existing cognitive decline cases in each group is known as a(n) rate. Such a design would be a_ study to calculate a(n) with the strongest evidence of exposure to factors coming from a. prevalence / prospective / relative risk / clinical records b. incidence / cross-sectional / odds ratio / subject recall C. prevalence / retrospective / relative risk / subject recall d. incidence / cross-sectional / relative risk / clinical records prevalence / retrospective / odds ratio / clinical records 12 45. Select the correct statement about nonparametric statistical procedures. Nonparametric procedures are generally thought to be less powerful than parametric procedures. a. The calculated statistic is a parameter estimate. C. The calculations are based on the raw data. d. All of the above are correct. Error Variance 46 The generic equation for a calculated statistic is The Treatment Variance a. True b. False 47. In a random sample of 2,000 prospective buyers of Products A or B, Product A was favored by 51% to 49% over Product B. Select the correct response below. a. Product A has a significantly greater preference percentage than Product B. b. Product B's preference percentage is outside the sampling error (a.k.a., 95% margin of error). C. Product B's preference percentage is within the margin of error. 48 In the Delphi method, a panel of experts have only one opportunity to respond to the questionnaire in order to direct future policy or arrive at a consensus. a True False 49 A variance based on sample data is calculated as Ziei(X-mean)? n True49. A variance based on sample data is calculated as (X-mean)? a. True False 50. In an electronic survey, a respondent's answer to a key question determines if respondents will be asked downstream questions based on the_ I feature in the software. a. directing b. streaming discrimination branching guiding 51. A research collects several data on several ratio-level dependent variables. The SPSS Explore procedure reveals severe skewness in all variables. Instead of her planned analyses using Pearson Product Moment Correlation, independent t-tests, and ONEWAY analysis of variance, she must use , and a. b . Mann-Whitney U-test / Kruskal-Wallis H-test / Spearman Rank Order Correlation Kruskal-Wallis H-test / Spearman Rank Order Correlation / Mann-Whitney U-test C. Spearman Rank Order Correlation / Mann-Whitney U-test / Kruskal-Wallis H-test 52 The variance caused by a blocking factor that is ignored during the research design, data collection, and data analysis phases of research will inflate the estimate of the error variance and increase the chance of committing a Type I error. a. True False A researcher examined the association between the gender of the runner (male/female) and race completed (marathon/1/2 marathon/8K) in the Shamrock Marathon weekend in competitors completing only one of the events. The data are presented in the following contingency table. Answer questions 52-55. Gender * Shamrock Event Crosstabulation Which race did you run this year? Total Marathon Half Marathon 8K Count 546 724 339 1609 Expected Count 395.2 802. 411.7 1609.0 Male % within Row (% by Race) 33.9% 45.0% 21.1% 100.0% % within Column (% by Gender) 61.4% 40.1% 36.6% 44.5% % of Total 15.1% 20.0% 9.4% 44.5% Gender Count 343 080 587 2010 Expected Count 493.8 1001.9 514.3 2010.0 Female % within Row (% by Race) 7.1% 53.7% 29.2% 100.0% % within Column (% by Gender) 8.6% 59.9% 63.4% 55.5% % of Total 9.5% 29.8% 16.2% 55.5% 13 889 1804 926 3619 Count 3619.0 Expected Count 889.0 1804.0 926.0 49.8% 25.6% 100.0% Total % within Row (% by Race) 24.6%Count 889 1804 Expected Count 926 3619 889.0 Total 1804.0 % within Row (% by Race) 926.0 3619.0 24.6% 49.8% 25.6% % within Column (% by Gender) 100.0% 100.0% 100.0% % of Total 100.0% 100.0% 24.6% 53. 49.8% 25.6% 100.0% What is the appropriate statistical procedure to test Ho:Pmales-PFemales in race run? a. dependent t-test oneway ANOVA repeated measures ANOVA d. Pearson product moment correlation coefficient e x test of independence 54. What is the critical statistical value to test Ho: Pmales-PFemales in participation in the three Shamrock Marathon events at a=0.05? a. 15.51 12.59 11.87 I 5.99 3.84 55. What is the calculated statistical value to test Ho: PMales-PFemales in participation in the three Shamrock Marathon events in 2007? 288.8 140.4 110.6 56.2 e. 2.7 56 Select the correct conclusion. a The percent of females participating in the marathon (38.6%) is significantly less than the percent of males participating in the marathon (61.4%) b. Over half of the registered females (53.7%) participated in the half-marathon with females representing 59.9% of half-marathon participants. C. There is no difference between males and females in percent participation in the race events. d. B and C are both correct. e A and B are both correct. 57. What is the potential effect of multiple t-tests to fully examine differences in a family of 3 or more means? a . Multiple t-tests decrease the Type I error rate. The probability of making a Type I error for a given t-test can be inflated above the overall a-level. The probability of making a Type II error for a given t-test can be inflated above the overall a-level. The probability of making a Type I error for a given t-test can be inflated above the overall B-level. e. The probability of making a Type II error for a given t-test can be inflated above the overall B-level. Descriptive statistics (MeantSD) from a large (n=300) sample of 50-59 year old females who were administered 58 Cooper's 12 min walk/run test are 1.210.15 miles. You use the normally distributed data from this large sample to assess the cardio-respiratory fitness of two clients. Client A covered 1.325 miles and Client B covered 1.075 miles. Select the correct statement below. Client A is at ~the 70th percentile while client B is at the ~30th percentile. a. Client A is at ~the 75th percentile while client B is at the ~25th percentile b. Client A is at ~the 80th percentile while client B is at the ~20th percentile C. d. Client A is at ~the 85th percentile while client B is at the ~15th percentile e. None of these statements is correct.\fConclusion decision by comparing calculated statistic to critical statistical value of by comparing p-value to a, Forty (n=40) overweight (BMI230 kg.m) subjects were grouped according to similar baseline BMI and randomly assigned to one of four dietary regimens (n-10 in A, B, C, and D). Within each diet, subjects were then matched in pairs with one subject receiving supplemental counseling (Diet+Counseling) while the other subject received no counseling (Diet+No Counseling). The dependent variable was weight loss after 4 months. Use the tables and graph provided below to answer questions 59-63. Counseling Diet Main Effect Yes No n Diet x Counseling Interaction Mean SD 15 19 Effect 12 9 A-Yes A-No 18 n 5 13 5 10 12.1 3.6 16 Mean 7 14.8 9.4 SD 13 2.4 2.2 9 25 13 19 B-Yes B-No 15 5 5 B 21 12 10 17.3 4.5 Mean 22 21.2 13.4 15 SD 2.5 1.5 Diet 19 12 19 13 C-Yes C-No 24 13 n 5 5 C 18 15 10 17.2 3.5 Mean 19.6 14.8 16 18 SD 3.0 2.0 21 15 22 33 D-Yes D-No 22 30 5 5 D 18 31 10 24.5 6.1 Mean 19.2 29.8 19 27 SD 2.9 2.4 15 28 n 20 20 n 40 Counseling Mean 16.9 Total Mean 17.8 Main Effect 18.7 SD 3.5 8.2 SD 6.3 Source Sum of Squares df Mean Square F Significant? Diet 779.875 3 Counseling 34.225 Diet x Counseling 529.275 3 Error 187.6 32 Total 1530.98 39Effect of four dietary regimens with and without counseling on weight loss in overweight subjects. Values are Mean+SD. A B C D 35 30 25 20 Weight loss (Ibs) 10 Yes No Counseling 50. Diet and counseling are between-subjects independent variables in this research design. a. True b. False 61 What is the appropriate statistical procedure to test the following null hypotheses: Ho: MeanCounseling-Yes- Meancounseling-No (Counseling main effect); Ho:MeanDiet A MeanDiet B- MeanDiet c=MeanDiet D (Diet main effect); Ho: MeanDiet A-Yes-MeanDiet A-No-MeanDiet B-Yes-MeanDiet B-No-MeanDiet C-Yes-MeanDiet C-No-MeanDiet D-Yes MeanDiet D-No diet x counseling interaction effect)? a. independent t-test dependent oneway ANOVA d. repeated measures ANOVA e. factorial ANOVA 62. What is the critical statistical value to test Ho:Meanpiet A=Meanpiet B= Meanpiet c=MeanDiet D and Ho: MeanDiet A- Yes MeanDiet A-No-MeanDiet B-Yes MeanDiet B-No MeanDiet C-Yes-MeanDiet C-No=MeanDiet D-Yes MeanDiet D-No at a=0.05? a. 2.90 b. 3.30 C. 4.46 d 5.34 e. 7.50 63 What is the critical statistical value to test Ho: Meancounseling-Yes Meancounseling-No at a=0.05? a. 1.96 b 2.89 C. 3.76 4.15 e. 6.53 64 Select the correct statement below.64. Select the correct statement below. a. Reject Ho: Meancounseling-Yes Meancounseling-No. Across all diets, weight loss with counseling was greater than weight loss without counseling. Based on a critical Tukey q statistic of 3.83, the honest significant difference between any two means for the Diet main effect is 2.93 lbs. C . B and C which Reject Ho: Ho:MeanDiet A=MeanDict B=Meanpiet c=MeanDiet D. Diet D results in greater weight loss than diets resulted in greater weight loss than Diet A. There is no difference in weight loss between Diets B and C. between the diets. d. Reject Ho: MeanDiet A-Yes-MeanDiet A-No MeanDiet B-Yes MeanDiet B-No=MeanDiet C-Yes MeanDiet C-No MeanDiet D-Yes-MeanDict D-No. Counseling increased weight loss compared to no counseling for Diets A, B, and C, but not for Diet D. e. All of these statements are correct. 16 65. A team of researchers plans a 36-month study comparing four combinations to create a 500 kcal day" deficit in subjects who are overweight (BMI-25-29.9 kg.m"?); Grade 1 obesity (BMI=30-34.9 kg.m ?); Grade 2 obesity (BMI=35-39.9 kg.m"?); and Grade 3 obesity (BMI240 kg.m?) on weight loss. Treatments are as follows:1=500 kcal day' added exercise; 2 500 kcal day diet restriction; 3=200 kcal day" caloric restriction+300 kcal day" added exercise; 4=300 kcal day ! caloric restriction+200 kcal day" added exercise. Baseline overweight/obesity grade is best handled in a research design and in statistical analysis as a factor. a. between-subjects b. blocking C. within-subjects d. repeated measures 66. If Ho: MeanGroup1=MeanGroup2-Mean Group3-MeanGroup4 cannot be rejected, the treatment variance is significantly greater than the error variance. a. True b. False 67. If subjects are nested within the levels of an independent variable, then the independent variable is a within- subjects factor. a. True b False 68. A multivariate data array is required in order to test for violations of the assumption of compound symmetry (homogeneity of variance and covariance) in repeated measures ANOVA. a. True b. False 69 In regression analysis, heteroscedasticity is the assumption of equality of variance across the strata of subgoups of Y that share the same value for X a True b. False or response surface in multiple linear regression minimizes the 70 The least squares line in simple linear regreD. False 70 The least squares line in simple linear regression, or response surface in multiple linear regression minimizes the sum of the squared residuals which are calculated _f-1 (YMeasured - Ypredicted) True False 17 MacBook Air
Step by Step Solution
There are 3 Steps involved in it
Step: 1
Get Instant Access to Expert-Tailored Solutions
See step-by-step solutions with expert insights and AI powered tools for academic success
Step: 2
Step: 3
Ace Your Homework with AI
Get the answers you need in no time with our AI-driven, step-by-step assistance