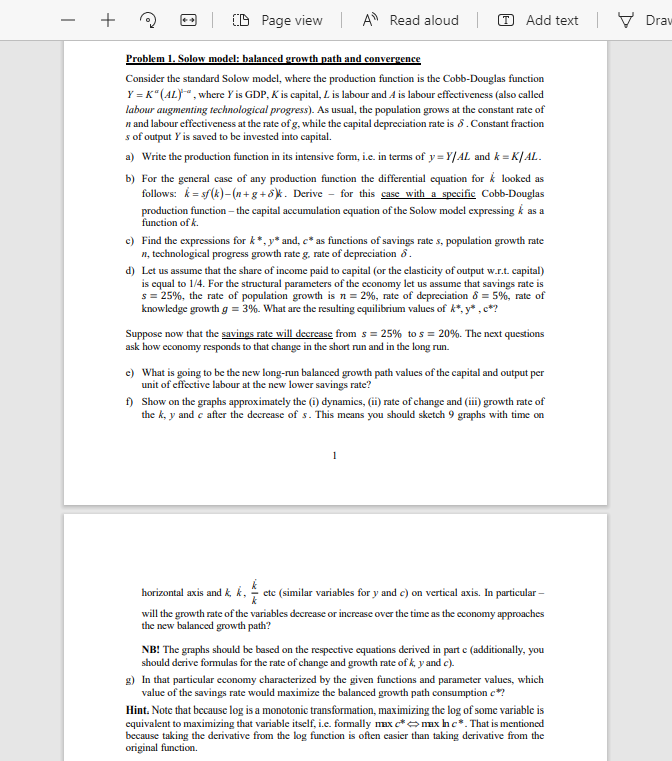
+ ID Page view | A Read aloud | Add text | Drau Problem 1. Solow model: balanced growth path and convergence Consider the standard Solow model, where the production function is the Cobb-Douglas function Y =K"(AL), where Y is GDP, K is capital, L is labour and A is labour effectiveness (also called labour augmenting technological progress). As usual, the population grows at the constant rate of n and labour effectiveness at the rate of g, while the capital depreciation rate is 8. Constant fraction s of output Yis saved to be invested into capital. a) Write the production function in its intensive form, i.e. in terms of y=Y/AL and k = K/AL. b) For the general case of any production function the differential equation for k looked as follows: k = f(k)-(n+g+8). Derive - for this case with a specific Cobb-Douglas production function, the capital accumulation equation of the Solow model expressing k as a function of k. c) Find the expressions for k* y* and, c* as functions of savings rates, population growth rate n, technological progress growth rate g, rate of depreciation 8. d) Let us assume that the share of income paid to capital (or the elasticity of output w.r.t. capital) is equal to 1/4. For the structural parameters of the economy let us assume that savings rate is s = 25%, the rate of population growth is n = 2%, rate of depreciation 8 = 5%, rate of knowledge growth g = 3%. What are the resulting equilibrium values of k*,y*,c*? Suppose now that the savings rate will decrease from s = 25% to s = 20%. The next questions ask how economy responds to that change in the short run and in the long run. c) What is going to be the new long-run balanced growth path values of the capital and output per unit of effective labour at the new lower savings rate? f) Show on the graphs approximately the (1) dynamics, (ii) rate of change and (iii) growth rate of the k, y and c after the decrease of s. This means you should sketch 9 graphs with time on 1 horizontal axis and k, k, cte (similar variables for y and c) on vertical axis. In particular will the growth rate of the variables decrease or increase over the time as the economy approaches the new balanced growth path? NB! The graphs should be based on the respective equations derived in part c (additionally, you should derive formulas for the rate of change and growth rate of k, y and c). .) In that particular economy characterized by the given functions and parameter values, which value of the savings rate would maximize the balanced growth path consumption c? Hint. Note that because log is a monotonic transformation, maximizing the log of some variable is equivalent to maximizing that variable itself, i.e. formally nexc* max hc. That is mentioned because taking the derivative from the log function is often casier than taking derivative from the original function. + ID Page view | A Read aloud | Add text | Drau Problem 1. Solow model: balanced growth path and convergence Consider the standard Solow model, where the production function is the Cobb-Douglas function Y =K"(AL), where Y is GDP, K is capital, L is labour and A is labour effectiveness (also called labour augmenting technological progress). As usual, the population grows at the constant rate of n and labour effectiveness at the rate of g, while the capital depreciation rate is 8. Constant fraction s of output Yis saved to be invested into capital. a) Write the production function in its intensive form, i.e. in terms of y=Y/AL and k = K/AL. b) For the general case of any production function the differential equation for k looked as follows: k = f(k)-(n+g+8). Derive - for this case with a specific Cobb-Douglas production function, the capital accumulation equation of the Solow model expressing k as a function of k. c) Find the expressions for k* y* and, c* as functions of savings rates, population growth rate n, technological progress growth rate g, rate of depreciation 8. d) Let us assume that the share of income paid to capital (or the elasticity of output w.r.t. capital) is equal to 1/4. For the structural parameters of the economy let us assume that savings rate is s = 25%, the rate of population growth is n = 2%, rate of depreciation 8 = 5%, rate of knowledge growth g = 3%. What are the resulting equilibrium values of k*,y*,c*? Suppose now that the savings rate will decrease from s = 25% to s = 20%. The next questions ask how economy responds to that change in the short run and in the long run. c) What is going to be the new long-run balanced growth path values of the capital and output per unit of effective labour at the new lower savings rate? f) Show on the graphs approximately the (1) dynamics, (ii) rate of change and (iii) growth rate of the k, y and c after the decrease of s. This means you should sketch 9 graphs with time on 1 horizontal axis and k, k, cte (similar variables for y and c) on vertical axis. In particular will the growth rate of the variables decrease or increase over the time as the economy approaches the new balanced growth path? NB! The graphs should be based on the respective equations derived in part c (additionally, you should derive formulas for the rate of change and growth rate of k, y and c). .) In that particular economy characterized by the given functions and parameter values, which value of the savings rate would maximize the balanced growth path consumption c? Hint. Note that because log is a monotonic transformation, maximizing the log of some variable is equivalent to maximizing that variable itself, i.e. formally nexc* max hc. That is mentioned because taking the derivative from the log function is often casier than taking derivative from the original function