Answered step by step
Verified Expert Solution
Question
1 Approved Answer
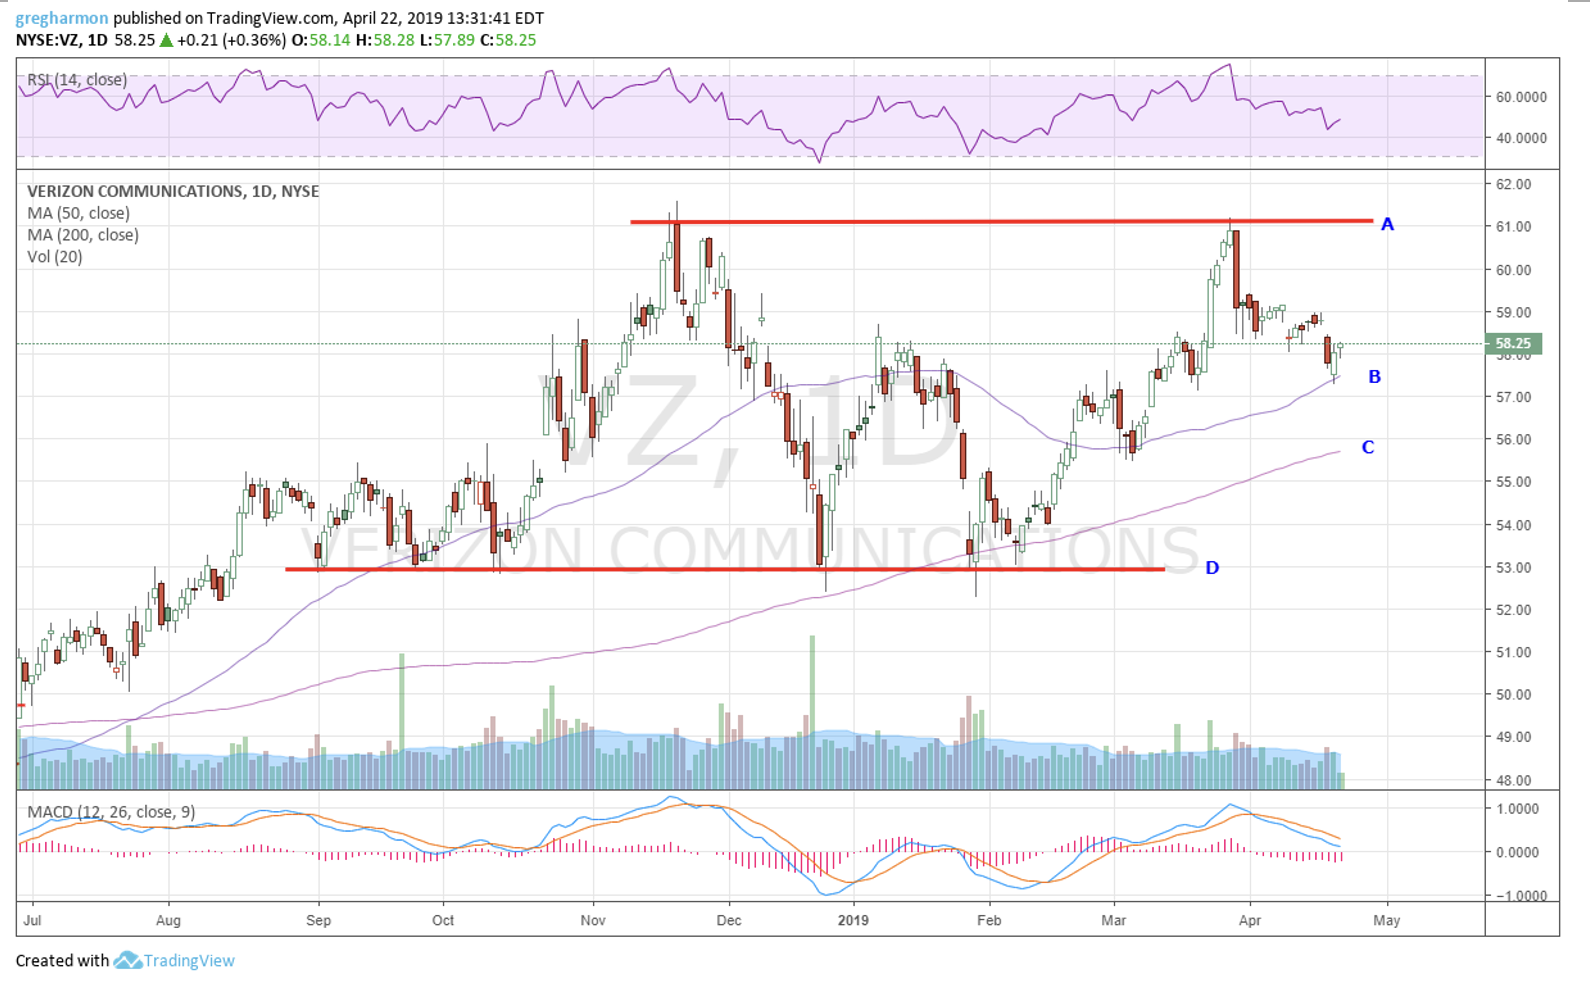
Identify points A, B, C, and D on the chart below (1 point each) What signal does the MACD give on the chart below? Is
Identify points A, B, C, and D on the chart below (1 point each)
What signal does the MACD give on the chart below?
Is the RSI in the bullish or bearish range?
At what point would one enter a long trade?
gregharmon published on Trading View.com, April 22, 2019 13:31:41 EDT NYSERVZ, 1D 58.25 +0.21 (+0.36%) 0:58.14 H:58.28 1:57.89 0:58.25 RS (14, close) m 60.0000 40.0000 62.00 VERIZON COMMUNICATIONS, 1D, NYSE MA (50, close) MA (200, close) Vol (20) A 61.00 60.00 59.00 58.25 Jovo B 57.00 Z 56.00 55.00 54.00 NI COMMENTAIONS, D 53.00 52.00 51.00 50.00 49.00 48.00 MACD (12, 26, close, 9) 1.0000 0.0000 -1.0000 Jul Aug Sep Oct Nov Dec 2019 Feb Mar Apr May Created with Trading View gregharmon published on Trading View.com, April 22, 2019 13:31:41 EDT NYSERVZ, 1D 58.25 +0.21 (+0.36%) 0:58.14 H:58.28 1:57.89 0:58.25 RS (14, close) m 60.0000 40.0000 62.00 VERIZON COMMUNICATIONS, 1D, NYSE MA (50, close) MA (200, close) Vol (20) A 61.00 60.00 59.00 58.25 Jovo B 57.00 Z 56.00 55.00 54.00 NI COMMENTAIONS, D 53.00 52.00 51.00 50.00 49.00 48.00 MACD (12, 26, close, 9) 1.0000 0.0000 -1.0000 Jul Aug Sep Oct Nov Dec 2019 Feb Mar Apr May Created with Trading ViewStep by Step Solution
There are 3 Steps involved in it
Step: 1
Get Instant Access to Expert-Tailored Solutions
See step-by-step solutions with expert insights and AI powered tools for academic success
Step: 2
Step: 3
Ace Your Homework with AI
Get the answers you need in no time with our AI-driven, step-by-step assistance
Get Started