

Answered step by step
Verified Expert Solution
Question
1 Approved Answer
IDENTIFY THE INDUSTRY-ANALYSIS OF FINANCIAL STATEMENT DATA Since companies in the same industry face similar opportunities and constraints, they tend to make similar invest- ment,
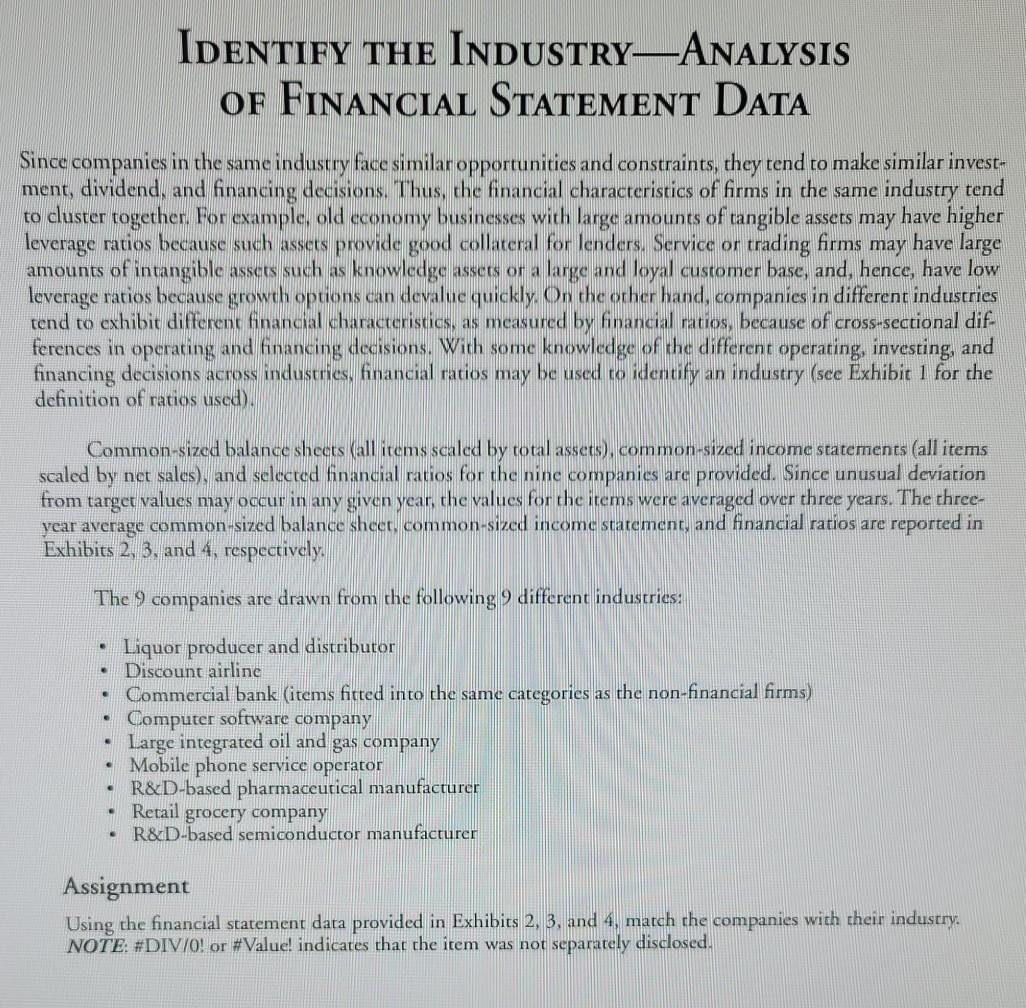
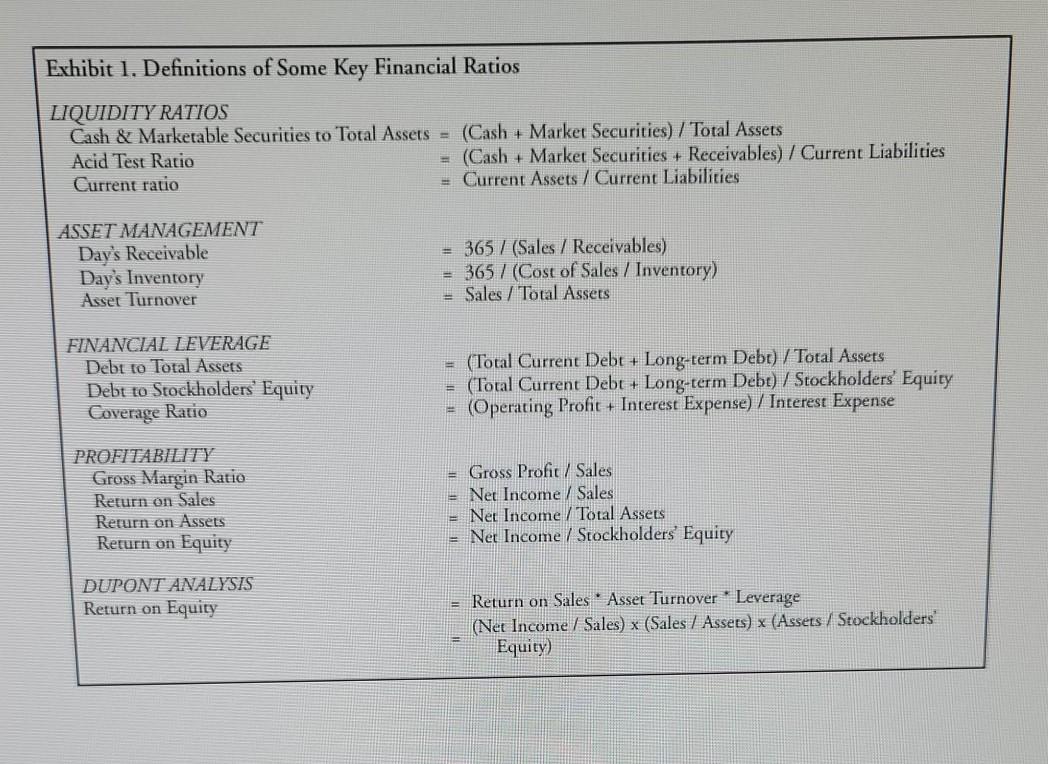
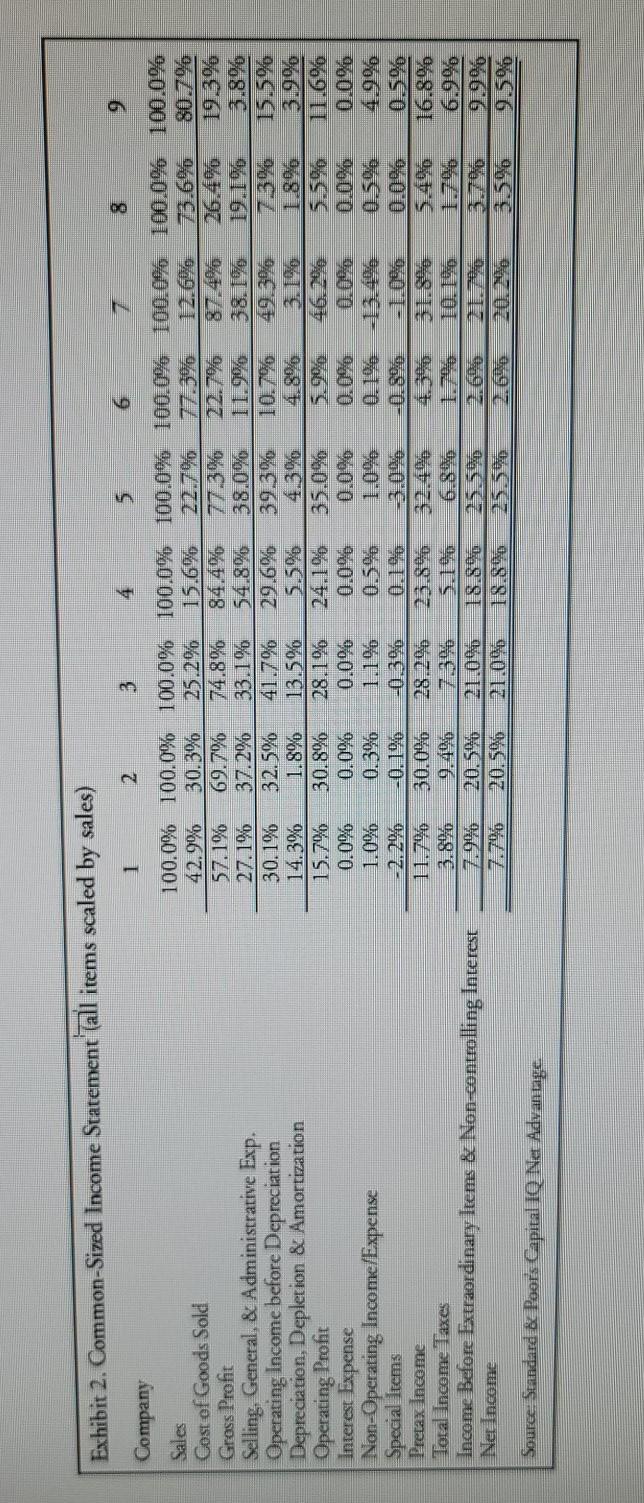
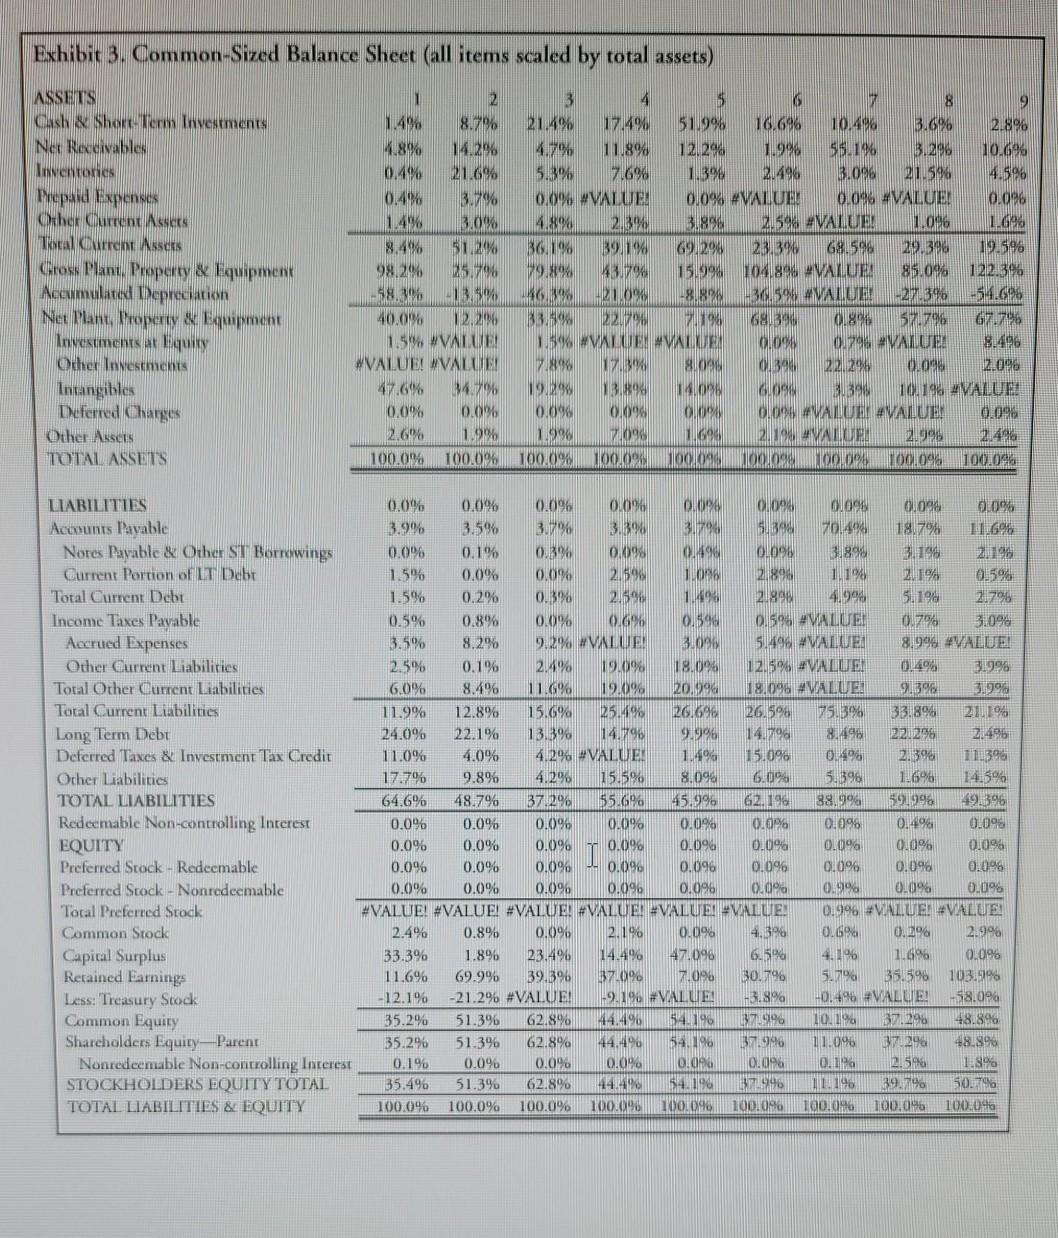
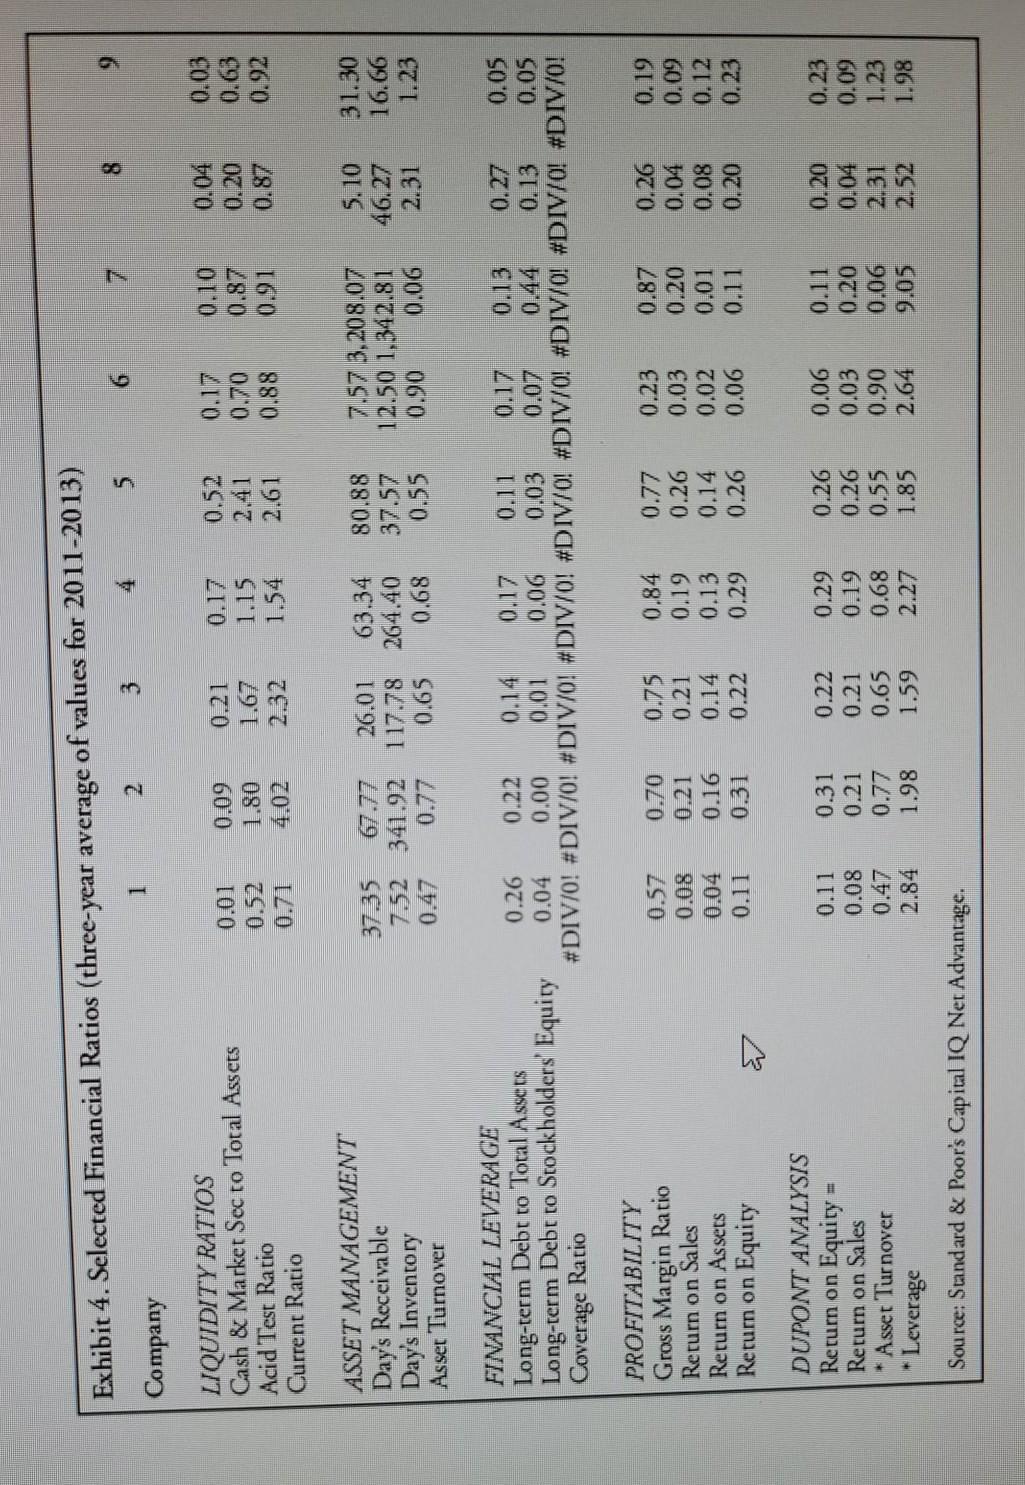
IDENTIFY THE INDUSTRY-ANALYSIS OF FINANCIAL STATEMENT DATA Since companies in the same industry face similar opportunities and constraints, they tend to make similar invest- ment, dividend, and financing decisions. Thus, the financial characteristics of firms in the same industry tend to cluster together. For example, old economy businesses with large amounts of tangible assets may have higher leverage ratios because such assets provide good collateral for lenders. Service or trading firms may have large amounts of intangible assets such as knowledge assets or a large and loyal customer base, and hence, have low leverage ratios because growth options can devalue quickly . On the other hand, companies in different industries tend to exhibit different financial characteristics, as measured by financial ratios, because of cross-sectional dif. ferences in operating and financing decisions. With some knowledge of the different operating, investing, and financing decisions across industries, financial ratios may be used to identify an industry (see Exhibit 1 for the definition of ratios used). Common-sized balance sheets (all items scaled by total assets), common-sized income statements (all items scaled by net sales), and selected financial ratios for the nine companies are provided. Since unusual deviation from target values may occur in any given year, the values for the items were averaged over three years. The three- year average common-sized balance sheet, common-sized income statement, and financial ratios are reported in Exhibits 2, 3. and 4, respectively. The 9 companies are drawn from the following 9 different industries: . . Liquor producer and distributor Discount airline Commercial bank (items fitted into the same categories as the non-financial firms) Computer software company Large integrated oil and gas company Mobile phone service operator R&D-based pharmaceutical manufacturer Retail grocery company R&D-based semiconductor manufacturer Assignment Using the financial statement data provided in Exhibits 2, 3, and 4, match che companies with their industry. NOTE: #DIV/0! or #Value! indicates that the item was not separately disclosed. Exhibit 1. Definitions of Some Key Financial Ratios LIQUIDITY RATIOS Cash & Marketable Securities to Total Assets = (Cash + Market Securities) / Total Assets Acid Test Ratio = (Cash + Market Securities + Receivables) / Current Liabilities Current ratio = Current Assets / Current Liabilities ASSET MANAGEMENT Dav's Receivable Day's Inventory Asset Turnover = 365 7 (Sales / Receivables) = 365 / (Cost of Sales / Inventory) - Sales / Total Assets FINANCIAL LEVERAGE Debt to Total Assets Debt to Stockholders' Equity Coverage Ratio = (Total Current Debt + Long-term Debt) / Total Assets = (Total Current Debt + Long-term Debt) / Stockholders' Equity (Operating Profit + Interest Expense) / Interest Expense PROFITABILITY Gross Margin Ratio Return on Sales Return on Assets Return on Equity - Gross Profit / Sales = Net Income / Sales = Net Income / Total Assets = Net Income / Stockholders' Equity DUPONT ANALYSIS Return on Equity Return on Sales Asset Turnover * Leverage (Net Income / Sales) x (Sales / Assets) x (Assets / Stockholders' Equity) Exhibit 2. Common-Sized Income Statement all items scaled by sales) 1 2 3 9 4. Company 100.0% 100.0% 100.0% 100.0% 100.0% 100.0% 100.0% 100.0% 100.0% Sales Cost of Goods Sold 42.9% 30.3% 25.2% 15.6% 73.6% 80.7% Gross Profit 57.1% 69.7% 74.8% 84.4% 19.3% Selling, General, & Administrative Exp. 27.1% 37.2% 33.1% 54.8% 38.0% 38.1% 19.1% 3.8% Operating Income before Depreciation 30.1% 32.5% 41.7% 29.6% 39.3% 10.7% 15.5% Depreciation, Depletion & Amortization 14.3% 1.8% 13.5% 4.8% 1.8% 3.9% Operating Profit 15.7% 30.8% 28.1% 24.1% 35.0% 5.9% 11.6% Interest Expense 0.0% 0.000 0.0% 0.000 0.0% Non-Operating Income/Expense 1.0% 0.39 0.500 4.900 Special Items 2.2% -0.19% -0.306 0.1% -0.800 Pretax Income 30.0% 5.4% 16.8% Total Income Taxes 3.890 6.8% Income Before Extraordinary Items & Non-controlling Interest 20.5% 18.89 Nerim.come 20.5% 21.096 3.5% Source: Standard & Poor's Capital IQ Net Advantage Exhibit 3. Common-Sized Balance Sheet (all items scaled by total assets) ASSETS Cash Short-Term Investments Net Rexeivable Inventones Prepaid Expenses Other Renswers Tostal Current Nssers Gross Plant Property & Equipment Accumulated Depreciation Net Mant, Property & Equipment Investments at Equity Other Investments Intangibles Deferred Charges Other Assets TOTAL ASSETS 2 1.4% 8.796 4.8% 14.29 0.4% 21.6% 0.4% 3.7% 1.49 3.0% 8.4% 51.2% 98.296 25.79% 98.3% -13.5% 40.0% 12.236 1.5 VALUE WVALUE! VALUE 47.6% 247 0.0% 0.0 2.6% 1.9% 100.0% 100.0% 3 5 7 8 2 21.4% 17.4% 51.9% 10.6% 10.498 3.6% 2.8% 4.7% 11.8% 12,298 1.998 55.1% 3.296 10.696 5.3% 7.698 1.390 2.496 3.090 21.5% 4.596 0.0% VALUE 0.0% #VALUE 0.096 #VALUE! 0.096 4.8% 2.3% 3.898 2,59 #VALUE! 1.096 1.6% 361 39.19 69,290 23.3% 68.596 29.390 19.590 29.8% 43.79 15.99 104,896 VALUE 85.04 122.3% 6.99 21.06 -88% -30,5% #VALUE! - 27.3% -54.6806 33.59 221790 2019 6839 0898 57.7% 67.7% 1.5% #VALUE VALUR COM 0.700 AVALUTA 7.8% 8. C390 221290 0.00 2.096 19.2% 13.898 140 B.09 BBW 10.196 VALUR 0.0% 0.09 CIDEN OLDS #VALUE #VALUER 0.096 1.9% 7.099 11696 2004 VALUES 2.999 2.46 100.0% 100.09 000 COOOOOOOOC.D 100.000 0.7% LIABILITIES Accounts Payable Notes Payable & Other ST Borrowings Current Portion of LT Debt Total Current Debt Income Taxes Payable Accrued Expenses Other Gurrent Liabilities Toral Other Current Liabilities Total Current Liabilities Long Term Debt Deferred Taxes & Investment Tax Credit Other Liabilities TOTAL LIABILITIES Redeemable Non-controlling Interest EQUITY Preferred Stock - Redeemable Preferred Stock - Nonredeemable Total Preferred Stock Common Stock Capital Surplus Retained Earnings Less: Treasury Stock Common Equity Shareholders Equity-Parent Nonredeemable Non-controlling Interest STOCKHOLDERS EQUITY TOTAL TOTAL LIABILITIES & EQUITY 0.0% 0.0% 0.0% 0.096 D. C109 OLOS 0.098 0.0% 3.9% 3.5% 3.7% 3.390 3.790 5,394 701495 1870 0.096 0.1% 0.3% 0.099 090 0.098 3.8% 3.12 1.5% 0.0% 0.0% 259 1.098 2.898 1.1% 21% 0.5% 1.5% 0.2% 0.3% 2.590 1.495 2.990 4.996 51190 21796 0.5% 0.8% 0.0% 0.6% 0.596 0.59 VALUE 3.09 3.5% 9.2% VALUE 3.098 5.490 #VALUE 8.990 #VALUE! 2.5% 0.1% 2.4% 19.0% 18.0% 12.5% #VALUE! 31996 6.0% 8.4% 11.6% 12.09 20.99 18.096 VALUE 91396 1.996 11.9% 12.8% 15.6% 25.490 26.696 26.596 75.3% 33.8% 21.1% 24.0% 22.1% 13.390 14.796 9.996 14.796 8.496 221296 11.0% 4.0% 4.29 #VALUE! 1.4% 15.0% 0.4% 2.396 11.396 17.7% 9.8% 4.29 15.5% 8.090 6.04 5.396 1.6% 14.5% 64.6% 48.7% 37.29 55.6% 45.996 62.190 88.9% 591996 19.396 0.0% 0.0% 0.096 0.0% 0.00% 0.0% 0.096 0.496 0.096 0.0% 0.0% 0.096 0.096 0.096 0.0% 0.0% 0.0% 0.096 0.0% 0.0% 0.0% 0.096 0.096 0.096 0.0% 0.096 0.096 0.0% 0.0% 0.0% 0.096 0.0% 0.0% 0.99% 0.09% 0.098 #VALUE! #VALUE! #VALUE! #VALUE! #VALUE! VALUE 0.996 #VALUE! VALUE 2.4% 0.8% 0.0% 2.19% 0.096 4.3% 0.69 0.89 2.996 33.3% 1.8% 23.4% 14.4% 47.096 6.596 4.196 1.6% 0.0% 11.6% 69.9% 39.396 37.09 7.096 30.796 5.71% 35.596 103.9196 - 12.196 -21.2% #VALUE! 9.196 #VALUE -3.8% 40.496 #VALUE! 58.0% 35.296 51.39 62.8% 44.496 54.196 3709196 10.196 371296 48.896 35.296 51.396 62.8% 44.496 54.196 37.996 11.096 37290 48.8% 0.196 0.096 0.0% 0.00 0.00 0.096 0.1126 2.596 1S 35.496 51.39 62.8% 44.490 54.190 1.9996 11. 196 39.79 50079 100.0% 100.0% 100.0% 100.090 100.090 100.046 100.096 100.0 100046 Exhibit 4. Selected Financial Ratios (three-year average of values for 2011-2013) 8 9 6 4 5 1 2 Company LIQUIDITY RATIOS Cash & Market Sec to Total Assets Acid Test Ratio Current Ratio 0.01 0.09 0.52 1.80 0.71 4.02 0.21 0.52 1.67 1.15 2.32 1.54 2.61 0.17 0.10 0.70 0.87 0.88 0.91 0.04 0.20 0.87 0.03 0.63 0.92 ASSET MANAGEMENT Day's Receivable Day's Inventory Asset Turnover 37.35 67.77 26.01 63.34 80.88 7.57 3.208.07 5.10 31.30 7.52 341.92 117.78 264.40 37.57 12.50 1.342.81 46.27 16.66 0.47 0.77 0.65 0.68 0.55 0.90 0.06 2.31 1.23 FINANCIAL LEVERAGE Long-term Debt to Total Assets Long-term Debt to Stockholders' Equity Coverage Ratio 0.26 0.22 0.14 0.17 0.11 0.17 0.13 0.27 0.05 0.04 0.00 0.01 0.06 0.03 0.07 0.44 0.13 0.05 #DIV/0! #DIV/0! #DIV/0! #DIV/0! #DIV/0! #DIV/0! #DIV/0! #DIV/0! #DIV/0! 0.84 PROFITABILITY Gross Margin Ratio Return on Sales Return on Assets Return on Equity 0.57 0.08 0.04 0.11 0.70 0.75 0.21 0.21 0.16 0.14 0.31 0.22 0.19 0.13 0.29 0.77 0.26 0.14 0.26 0.23 0.87 0.03 0.20 0.02 0.01 0.06 0.11 0.26 0.04 0.08 0.20 0.19 0.09 0.12 0.23 DUPONT ANALYSIS Return on Equity = 0.11 Return on Sales 0.08 * Asset Turnover 0.47 * Leverage 2.84 Source: Standard & Poor's Capital IQ Net Advantage. 0.31 0.22 0.29 0.26 0.06 0.21 0.21 0.19 0.26 0.03 0.77 0.65 0.68 0.55 0.90 1.98 1.59 2.27 1.85 2.64 0.11 0.20 0.20 0.04 0.06 2.31 9.05 2.52 0.23 0.09 1.23 1.98 IDENTIFY THE INDUSTRY-ANALYSIS OF FINANCIAL STATEMENT DATA Since companies in the same industry face similar opportunities and constraints, they tend to make similar invest- ment, dividend, and financing decisions. Thus, the financial characteristics of firms in the same industry tend to cluster together. For example, old economy businesses with large amounts of tangible assets may have higher leverage ratios because such assets provide good collateral for lenders. Service or trading firms may have large amounts of intangible assets such as knowledge assets or a large and loyal customer base, and hence, have low leverage ratios because growth options can devalue quickly . On the other hand, companies in different industries tend to exhibit different financial characteristics, as measured by financial ratios, because of cross-sectional dif. ferences in operating and financing decisions. With some knowledge of the different operating, investing, and financing decisions across industries, financial ratios may be used to identify an industry (see Exhibit 1 for the definition of ratios used). Common-sized balance sheets (all items scaled by total assets), common-sized income statements (all items scaled by net sales), and selected financial ratios for the nine companies are provided. Since unusual deviation from target values may occur in any given year, the values for the items were averaged over three years. The three- year average common-sized balance sheet, common-sized income statement, and financial ratios are reported in Exhibits 2, 3. and 4, respectively. The 9 companies are drawn from the following 9 different industries: . . Liquor producer and distributor Discount airline Commercial bank (items fitted into the same categories as the non-financial firms) Computer software company Large integrated oil and gas company Mobile phone service operator R&D-based pharmaceutical manufacturer Retail grocery company R&D-based semiconductor manufacturer Assignment Using the financial statement data provided in Exhibits 2, 3, and 4, match che companies with their industry. NOTE: #DIV/0! or #Value! indicates that the item was not separately disclosed. Exhibit 1. Definitions of Some Key Financial Ratios LIQUIDITY RATIOS Cash & Marketable Securities to Total Assets = (Cash + Market Securities) / Total Assets Acid Test Ratio = (Cash + Market Securities + Receivables) / Current Liabilities Current ratio = Current Assets / Current Liabilities ASSET MANAGEMENT Dav's Receivable Day's Inventory Asset Turnover = 365 7 (Sales / Receivables) = 365 / (Cost of Sales / Inventory) - Sales / Total Assets FINANCIAL LEVERAGE Debt to Total Assets Debt to Stockholders' Equity Coverage Ratio = (Total Current Debt + Long-term Debt) / Total Assets = (Total Current Debt + Long-term Debt) / Stockholders' Equity (Operating Profit + Interest Expense) / Interest Expense PROFITABILITY Gross Margin Ratio Return on Sales Return on Assets Return on Equity - Gross Profit / Sales = Net Income / Sales = Net Income / Total Assets = Net Income / Stockholders' Equity DUPONT ANALYSIS Return on Equity Return on Sales Asset Turnover * Leverage (Net Income / Sales) x (Sales / Assets) x (Assets / Stockholders' Equity) Exhibit 2. Common-Sized Income Statement all items scaled by sales) 1 2 3 9 4. Company 100.0% 100.0% 100.0% 100.0% 100.0% 100.0% 100.0% 100.0% 100.0% Sales Cost of Goods Sold 42.9% 30.3% 25.2% 15.6% 73.6% 80.7% Gross Profit 57.1% 69.7% 74.8% 84.4% 19.3% Selling, General, & Administrative Exp. 27.1% 37.2% 33.1% 54.8% 38.0% 38.1% 19.1% 3.8% Operating Income before Depreciation 30.1% 32.5% 41.7% 29.6% 39.3% 10.7% 15.5% Depreciation, Depletion & Amortization 14.3% 1.8% 13.5% 4.8% 1.8% 3.9% Operating Profit 15.7% 30.8% 28.1% 24.1% 35.0% 5.9% 11.6% Interest Expense 0.0% 0.000 0.0% 0.000 0.0% Non-Operating Income/Expense 1.0% 0.39 0.500 4.900 Special Items 2.2% -0.19% -0.306 0.1% -0.800 Pretax Income 30.0% 5.4% 16.8% Total Income Taxes 3.890 6.8% Income Before Extraordinary Items & Non-controlling Interest 20.5% 18.89 Nerim.come 20.5% 21.096 3.5% Source: Standard & Poor's Capital IQ Net Advantage Exhibit 3. Common-Sized Balance Sheet (all items scaled by total assets) ASSETS Cash Short-Term Investments Net Rexeivable Inventones Prepaid Expenses Other Renswers Tostal Current Nssers Gross Plant Property & Equipment Accumulated Depreciation Net Mant, Property & Equipment Investments at Equity Other Investments Intangibles Deferred Charges Other Assets TOTAL ASSETS 2 1.4% 8.796 4.8% 14.29 0.4% 21.6% 0.4% 3.7% 1.49 3.0% 8.4% 51.2% 98.296 25.79% 98.3% -13.5% 40.0% 12.236 1.5 VALUE WVALUE! VALUE 47.6% 247 0.0% 0.0 2.6% 1.9% 100.0% 100.0% 3 5 7 8 2 21.4% 17.4% 51.9% 10.6% 10.498 3.6% 2.8% 4.7% 11.8% 12,298 1.998 55.1% 3.296 10.696 5.3% 7.698 1.390 2.496 3.090 21.5% 4.596 0.0% VALUE 0.0% #VALUE 0.096 #VALUE! 0.096 4.8% 2.3% 3.898 2,59 #VALUE! 1.096 1.6% 361 39.19 69,290 23.3% 68.596 29.390 19.590 29.8% 43.79 15.99 104,896 VALUE 85.04 122.3% 6.99 21.06 -88% -30,5% #VALUE! - 27.3% -54.6806 33.59 221790 2019 6839 0898 57.7% 67.7% 1.5% #VALUE VALUR COM 0.700 AVALUTA 7.8% 8. C390 221290 0.00 2.096 19.2% 13.898 140 B.09 BBW 10.196 VALUR 0.0% 0.09 CIDEN OLDS #VALUE #VALUER 0.096 1.9% 7.099 11696 2004 VALUES 2.999 2.46 100.0% 100.09 000 COOOOOOOOC.D 100.000 0.7% LIABILITIES Accounts Payable Notes Payable & Other ST Borrowings Current Portion of LT Debt Total Current Debt Income Taxes Payable Accrued Expenses Other Gurrent Liabilities Toral Other Current Liabilities Total Current Liabilities Long Term Debt Deferred Taxes & Investment Tax Credit Other Liabilities TOTAL LIABILITIES Redeemable Non-controlling Interest EQUITY Preferred Stock - Redeemable Preferred Stock - Nonredeemable Total Preferred Stock Common Stock Capital Surplus Retained Earnings Less: Treasury Stock Common Equity Shareholders Equity-Parent Nonredeemable Non-controlling Interest STOCKHOLDERS EQUITY TOTAL TOTAL LIABILITIES & EQUITY 0.0% 0.0% 0.0% 0.096 D. C109 OLOS 0.098 0.0% 3.9% 3.5% 3.7% 3.390 3.790 5,394 701495 1870 0.096 0.1% 0.3% 0.099 090 0.098 3.8% 3.12 1.5% 0.0% 0.0% 259 1.098 2.898 1.1% 21% 0.5% 1.5% 0.2% 0.3% 2.590 1.495 2.990 4.996 51190 21796 0.5% 0.8% 0.0% 0.6% 0.596 0.59 VALUE 3.09 3.5% 9.2% VALUE 3.098 5.490 #VALUE 8.990 #VALUE! 2.5% 0.1% 2.4% 19.0% 18.0% 12.5% #VALUE! 31996 6.0% 8.4% 11.6% 12.09 20.99 18.096 VALUE 91396 1.996 11.9% 12.8% 15.6% 25.490 26.696 26.596 75.3% 33.8% 21.1% 24.0% 22.1% 13.390 14.796 9.996 14.796 8.496 221296 11.0% 4.0% 4.29 #VALUE! 1.4% 15.0% 0.4% 2.396 11.396 17.7% 9.8% 4.29 15.5% 8.090 6.04 5.396 1.6% 14.5% 64.6% 48.7% 37.29 55.6% 45.996 62.190 88.9% 591996 19.396 0.0% 0.0% 0.096 0.0% 0.00% 0.0% 0.096 0.496 0.096 0.0% 0.0% 0.096 0.096 0.096 0.0% 0.0% 0.0% 0.096 0.0% 0.0% 0.0% 0.096 0.096 0.096 0.0% 0.096 0.096 0.0% 0.0% 0.0% 0.096 0.0% 0.0% 0.99% 0.09% 0.098 #VALUE! #VALUE! #VALUE! #VALUE! #VALUE! VALUE 0.996 #VALUE! VALUE 2.4% 0.8% 0.0% 2.19% 0.096 4.3% 0.69 0.89 2.996 33.3% 1.8% 23.4% 14.4% 47.096 6.596 4.196 1.6% 0.0% 11.6% 69.9% 39.396 37.09 7.096 30.796 5.71% 35.596 103.9196 - 12.196 -21.2% #VALUE! 9.196 #VALUE -3.8% 40.496 #VALUE! 58.0% 35.296 51.39 62.8% 44.496 54.196 3709196 10.196 371296 48.896 35.296 51.396 62.8% 44.496 54.196 37.996 11.096 37290 48.8% 0.196 0.096 0.0% 0.00 0.00 0.096 0.1126 2.596 1S 35.496 51.39 62.8% 44.490 54.190 1.9996 11. 196 39.79 50079 100.0% 100.0% 100.0% 100.090 100.090 100.046 100.096 100.0 100046 Exhibit 4. Selected Financial Ratios (three-year average of values for 2011-2013) 8 9 6 4 5 1 2 Company LIQUIDITY RATIOS Cash & Market Sec to Total Assets Acid Test Ratio Current Ratio 0.01 0.09 0.52 1.80 0.71 4.02 0.21 0.52 1.67 1.15 2.32 1.54 2.61 0.17 0.10 0.70 0.87 0.88 0.91 0.04 0.20 0.87 0.03 0.63 0.92 ASSET MANAGEMENT Day's Receivable Day's Inventory Asset Turnover 37.35 67.77 26.01 63.34 80.88 7.57 3.208.07 5.10 31.30 7.52 341.92 117.78 264.40 37.57 12.50 1.342.81 46.27 16.66 0.47 0.77 0.65 0.68 0.55 0.90 0.06 2.31 1.23 FINANCIAL LEVERAGE Long-term Debt to Total Assets Long-term Debt to Stockholders' Equity Coverage Ratio 0.26 0.22 0.14 0.17 0.11 0.17 0.13 0.27 0.05 0.04 0.00 0.01 0.06 0.03 0.07 0.44 0.13 0.05 #DIV/0! #DIV/0! #DIV/0! #DIV/0! #DIV/0! #DIV/0! #DIV/0! #DIV/0! #DIV/0! 0.84 PROFITABILITY Gross Margin Ratio Return on Sales Return on Assets Return on Equity 0.57 0.08 0.04 0.11 0.70 0.75 0.21 0.21 0.16 0.14 0.31 0.22 0.19 0.13 0.29 0.77 0.26 0.14 0.26 0.23 0.87 0.03 0.20 0.02 0.01 0.06 0.11 0.26 0.04 0.08 0.20 0.19 0.09 0.12 0.23 DUPONT ANALYSIS Return on Equity = 0.11 Return on Sales 0.08 * Asset Turnover 0.47 * Leverage 2.84 Source: Standard & Poor's Capital IQ Net Advantage. 0.31 0.22 0.29 0.26 0.06 0.21 0.21 0.19 0.26 0.03 0.77 0.65 0.68 0.55 0.90 1.98 1.59 2.27 1.85 2.64 0.11 0.20 0.20 0.04 0.06 2.31 9.05 2.52 0.23 0.09 1.23 1.98
Step by Step Solution
There are 3 Steps involved in it
Step: 1

Get Instant Access to Expert-Tailored Solutions
See step-by-step solutions with expert insights and AI powered tools for academic success
Step: 2

Step: 3
Ace Your Homework with AI
Get the answers you need in no time with our AI-driven, step-by-step assistance
Get Started
Public Private Partnerships Principles Of Policy And Finance
Authors: E. R. Yescombe
1st Edition
0750680547