

Answered step by step
Verified Expert Solution
Question
1 Approved Answer
identify the most likely leakage source within a toxic waste site. In a toxic waste disposal site, contaminants are stored in barrels that are
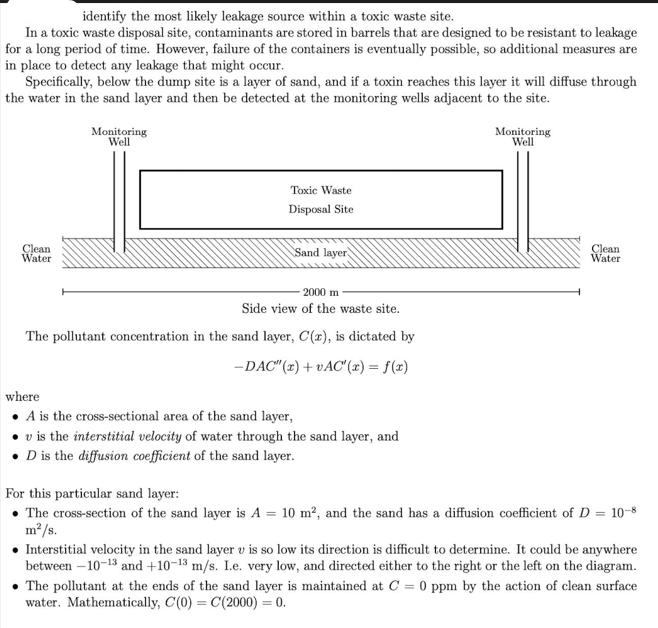
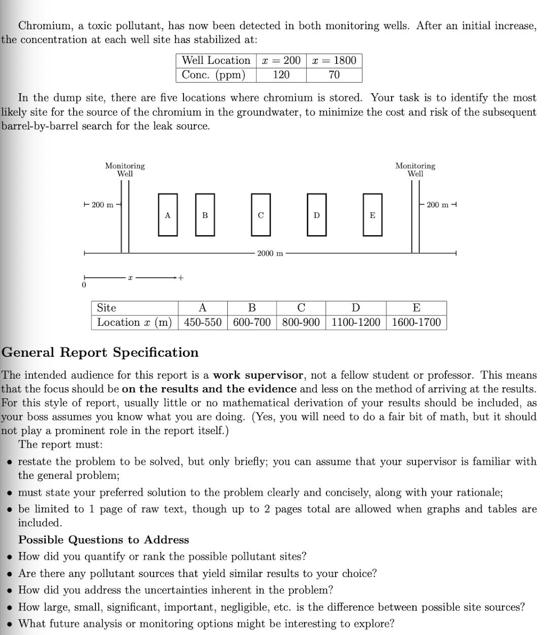
identify the most likely leakage source within a toxic waste site. In a toxic waste disposal site, contaminants are stored in barrels that are designed to be resistant to leakage for a long period of time. However, failure of the containers is eventually possible, so additional measures are in place to detect any leakage that might occur. Specifically, below the dump site is a layer of sand, and if a toxin reaches this layer it will diffuse through the water in the sand layer and then be detected at the monitoring wells adjacent to the site. Clean Water Monitoring Well Toxic Waste Disposal Site Sand layer Monitoring Well Clean Water 2000 m Side view of the waste site. The pollutant concentration in the sand layer, C(x), is dictated by where -DAC" (x) + vAC'(x) = f(x) A is the cross-sectional area of the sand layer, vis the interstitial velocity of water through the sand layer, and D is the diffusion coefficient of the sand layer. For this particular sand layer: The cross-section of the sand layer is A = 10 m, and the sand has a diffusion coefficient of D = 10-8 m/s. Interstitial velocity in the sand layer v is so low its direction is difficult to determine. It could be anywhere between -10-13 and +10-13 m/s. I.e. very low, and directed either to the right or the left on the diagram. The pollutant at the ends of the sand layer is maintained at C = 0 ppm by the action of clean surface water. Mathematically, C(0) C(2000) = 0. Chromium, a toxic pollutant, has now been detected in both monitoring wells. After an initial increase, the concentration at each well site has stabilized at: Well Location Conc. (ppm) = 200 = 1800 120 70 In the dump site, there are five locations where chromium is stored. Your task is to identify the most likely site for the source of the chromium in the groundwater, to minimize the cost and risk of the subsequent barrel-by-barrel search for the leak source. Monitoring Well 200 m B Site 2000 m- Monitoring Well 200 m- D E A B C D E Location (m) 450-550 600-700 800-900 1100-1200 1600-1700 General Report Specification The intended audience for this report is a work supervisor, not a fellow student or professor. This means that the focus should be on the results and the evidence and less on the method of arriving at the results. For this style of report, usually little or no mathematical derivation of your results should be included, as your boss assumes you know what you are doing. (Yes, you will need to do a fair bit of math, but it should not play a prominent role in the report itself.) The report must: restate the problem to be solved, but only briefly; you can assume that your supervisor is familiar with the general problem; must state your preferred solution to the problem clearly and concisely, along with your rationale; be limited to 1 page of raw text, though up to 2 pages total are allowed when graphs and tables are included. Possible Questions to Address How did you quantify or rank the possible pollutant sites? Are there any pollutant sources that yield similar results to your choice? How did you address the uncertainties inherent in the problem? How large, small, significant, important, negligible, etc. is the difference between possible site sources? What future analysis or monitoring options might be interesting to explore?
Step by Step Solution
There are 3 Steps involved in it
Step: 1

Get Instant Access to Expert-Tailored Solutions
See step-by-step solutions with expert insights and AI powered tools for academic success
Step: 2

Step: 3
Ace Your Homework with AI
Get the answers you need in no time with our AI-driven, step-by-step assistance
Get Started
Intermediate Accounting
Authors: James D. Stice, Earl K. Stice, Fred Skousen
17th Edition
032459237X, 978-0324592375