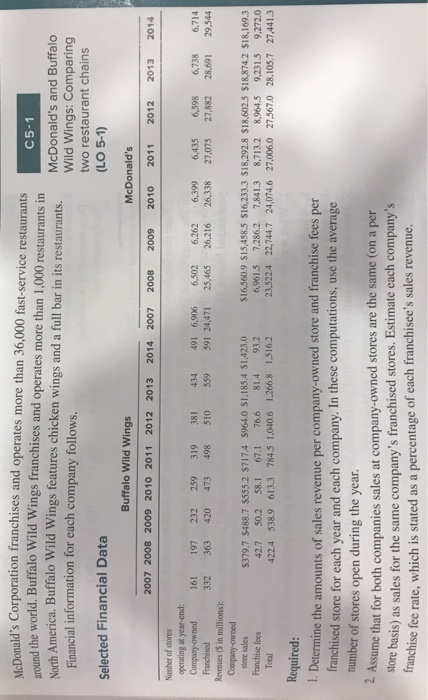
Id's Corporation franchises and operates more than 36,000 fast-service restaurants nd the world. Buffalo Wild Wings franchises and operates more than 1,000 restaurants in h America. Buffalo Wild Wings features chicken wings and a full bar in its restaurants. McDonalds C5-1 McDonald's and Buffalo Wild Wings: Comparing two restaurant chains r in its restaurants. Financial information for each company follows. Selected Financial Data (LO 5-1) Buffalo Wild Wings McDonald's 2007 2008 2009 2010 2011 2012 2013 2014 2007 2008 2009 2010 2011 2012 2013 2014 61 197 232 259 319 381 434 491 6,906 6,502 6262 6,399 6,435 6,598 6,738 6,714 332 363 420 473 498 510 559 591 24,471 25,465 26,216 26,338 27,075 27,882 28,691 29,544 store sales Pranchise fees $379.7 $488.7 $555.2 $717.4 $964.0 $1,185.4 $1,423.0 $16,560.9 $15,458.5 $16,233.3 $18,292.8 $18,602.5 $18,874.2 $18,169.3 6,961.5 7,286.2 7,841.3 8,713.2 8,964.5 9,231.5 9,2720 23,522.4 22,744.7 24,074.6 27,006.0 27,567.0 28,105.7 27,441.3 42.7 50.2 58.1 67.1 76.6 81.4 93.2 422.4 538.9 613.3 784.5 1,040.6 1,266.8 1,516.2 Required: 1. Determine the amounts of sales revenue per company-owned store and franchise fees per Tranchised store for each year and each company. In these computations, use the average number of stores open during the year. e that for both companies sales at company-owned stores are the same (on a per store basis) as sales for the same company's franchised stores. Estimate each company's Tranchise fee rate, which is stated as a percentage of each franchisee's sales revenue. 3. Perform a cause-of-change analysis from 2008 to 2011 for each company to disaggregatc the increase in revenues from company-owned stores between growth in the average n ber of average stores open and growth in revenues per store. Also perform a cause-of um change analysis from 2011 to 2014 4. Perform similar analyses for franchise fee revenues. 5. What do your analyses from requirements 3 and 4 tell you about the companies' growth strategies and how they differ from each other and over time? Id's Corporation franchises and operates more than 36,000 fast-service restaurants nd the world. Buffalo Wild Wings franchises and operates more than 1,000 restaurants in h America. Buffalo Wild Wings features chicken wings and a full bar in its restaurants. McDonalds C5-1 McDonald's and Buffalo Wild Wings: Comparing two restaurant chains r in its restaurants. Financial information for each company follows. Selected Financial Data (LO 5-1) Buffalo Wild Wings McDonald's 2007 2008 2009 2010 2011 2012 2013 2014 2007 2008 2009 2010 2011 2012 2013 2014 61 197 232 259 319 381 434 491 6,906 6,502 6262 6,399 6,435 6,598 6,738 6,714 332 363 420 473 498 510 559 591 24,471 25,465 26,216 26,338 27,075 27,882 28,691 29,544 store sales Pranchise fees $379.7 $488.7 $555.2 $717.4 $964.0 $1,185.4 $1,423.0 $16,560.9 $15,458.5 $16,233.3 $18,292.8 $18,602.5 $18,874.2 $18,169.3 6,961.5 7,286.2 7,841.3 8,713.2 8,964.5 9,231.5 9,2720 23,522.4 22,744.7 24,074.6 27,006.0 27,567.0 28,105.7 27,441.3 42.7 50.2 58.1 67.1 76.6 81.4 93.2 422.4 538.9 613.3 784.5 1,040.6 1,266.8 1,516.2 Required: 1. Determine the amounts of sales revenue per company-owned store and franchise fees per Tranchised store for each year and each company. In these computations, use the average number of stores open during the year. e that for both companies sales at company-owned stores are the same (on a per store basis) as sales for the same company's franchised stores. Estimate each company's Tranchise fee rate, which is stated as a percentage of each franchisee's sales revenue. 3. Perform a cause-of-change analysis from 2008 to 2011 for each company to disaggregatc the increase in revenues from company-owned stores between growth in the average n ber of average stores open and growth in revenues per store. Also perform a cause-of um change analysis from 2011 to 2014 4. Perform similar analyses for franchise fee revenues. 5. What do your analyses from requirements 3 and 4 tell you about the companies' growth strategies and how they differ from each other and over time