Question
If link doesn't work: https://phet.colorado.edu/sims/html/charges-and-fields/latest/charges-and-fields_en.html 1. Go to https://phet.colorado.edu/sims/html/charges-and-fields/latest/charges-and-fields_en.html and place 3 positive 1 nC charges on top of each other near the center of
If link doesn't work: https://phet.colorado.edu/sims/html/charges-and-fields/latest/charges-and-fields_en.html
1. Go to https://phet.colorado.edu/sims/html/charges-and-fields/latest/charges-and-fields_en.html and place 3 positive 1 nC charges on top of each other near the center of the field. (The charges should be literally on top of each other, not stacked up like a snowman.) Uncheck the Electric Field box since we will be looking at Potential now instead. Drag the blue potential meter over to the charges, and place it where the reading is as close as you can get it to 200 Volts. Click on the pencil to draw an equipotential line at that voltage. Draw additional lines at 150 V, 100 V, and 50 V. Are these lines equally spaced? (In other words, is potential directly proportional to distance?) If not, how are potential and distance related? (Hint: see the equation in your lecture notes for calculating potential due to a point charge.)
2. Now that you are looking at the correct equation, use it to calculate what the potential should be at a distance of 2.0 m away from the center of this 3.0 nC charge. 3. Use the potential meter (and the measuring tape) to test the calculation you just did. Do the values match?
4. Now clear the screen, check the Grid box, and place a single positive charge and a single negative charge 3 m apart. Drag the potential meter slowly from the positive charge to the negative charge, watching the voltage reading as it changes. Describe how the voltage varies as you go from one charge to the other. (You can also visualize this by checking the Voltage box.)
5. What is the voltage halfway between the charges?
6. Show, using a calculation with the charge and distance values, why the answer to the previous step has the value that it does.
7. Now, making sure that the charges are precisely lined up with the grid, carefully choose a random location on the line between the two charges, and measure the potential at that point.
8. Again, using a calculation with the charge and carefully measured distance values, show why the answer to the previous step has the value that it does.
9. Clear the screen, and carefully set up the following four charges at the corners of a square of side length 3 m: +2 nC, +3 nC, -4 nC, -5 nC (it doesn't matter which charge goes on which corner). Carefully measure the potential at the center of the square.
10. Again, using a calculation with the charge and distance values, show why the answer to the previous step has the value that it does.
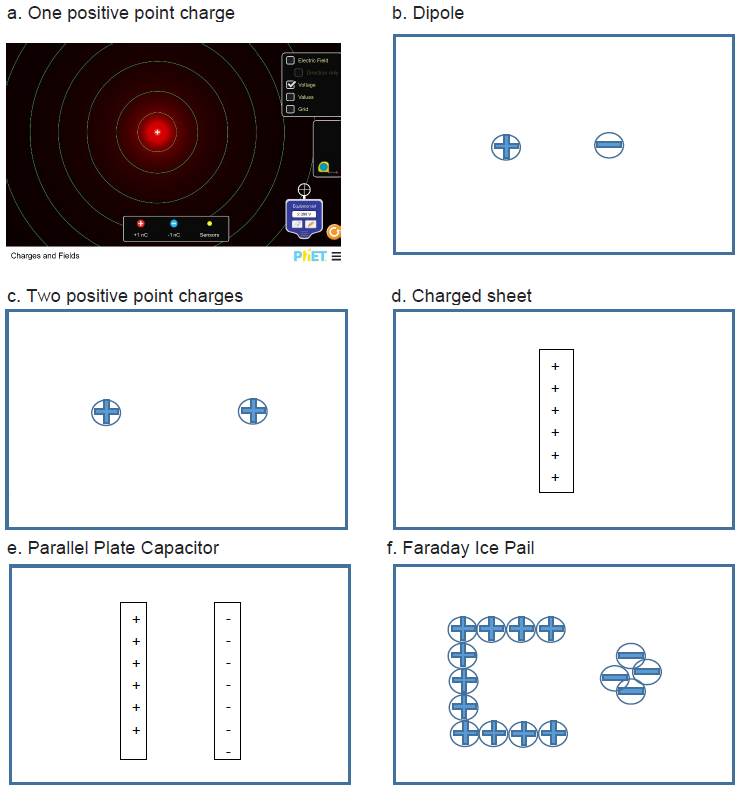
11. Now set up each of the following charge distributions, and use the potential meter to draw enough equipotential lines to create a map that fills the screen. The voltage of each line is not important here - we're just looking for the shapes of the equipotential surfaces. Also, check the 'Voltage' box to illustrate the signs of the voltages. The first map has been done for you as an example:

Step by Step Solution
There are 3 Steps involved in it
Step: 1

Get Instant Access to Expert-Tailored Solutions
See step-by-step solutions with expert insights and AI powered tools for academic success
Step: 2

Step: 3

Ace Your Homework with AI
Get the answers you need in no time with our AI-driven, step-by-step assistance
Get Started


