Answered step by step
Verified Expert Solution
Link Copied!

Question

1 Approved Answer

If necessary, please include a picture of the graphs. Otherwise, write the best possible answer. 1.) Athletes competed for medals in different track and field
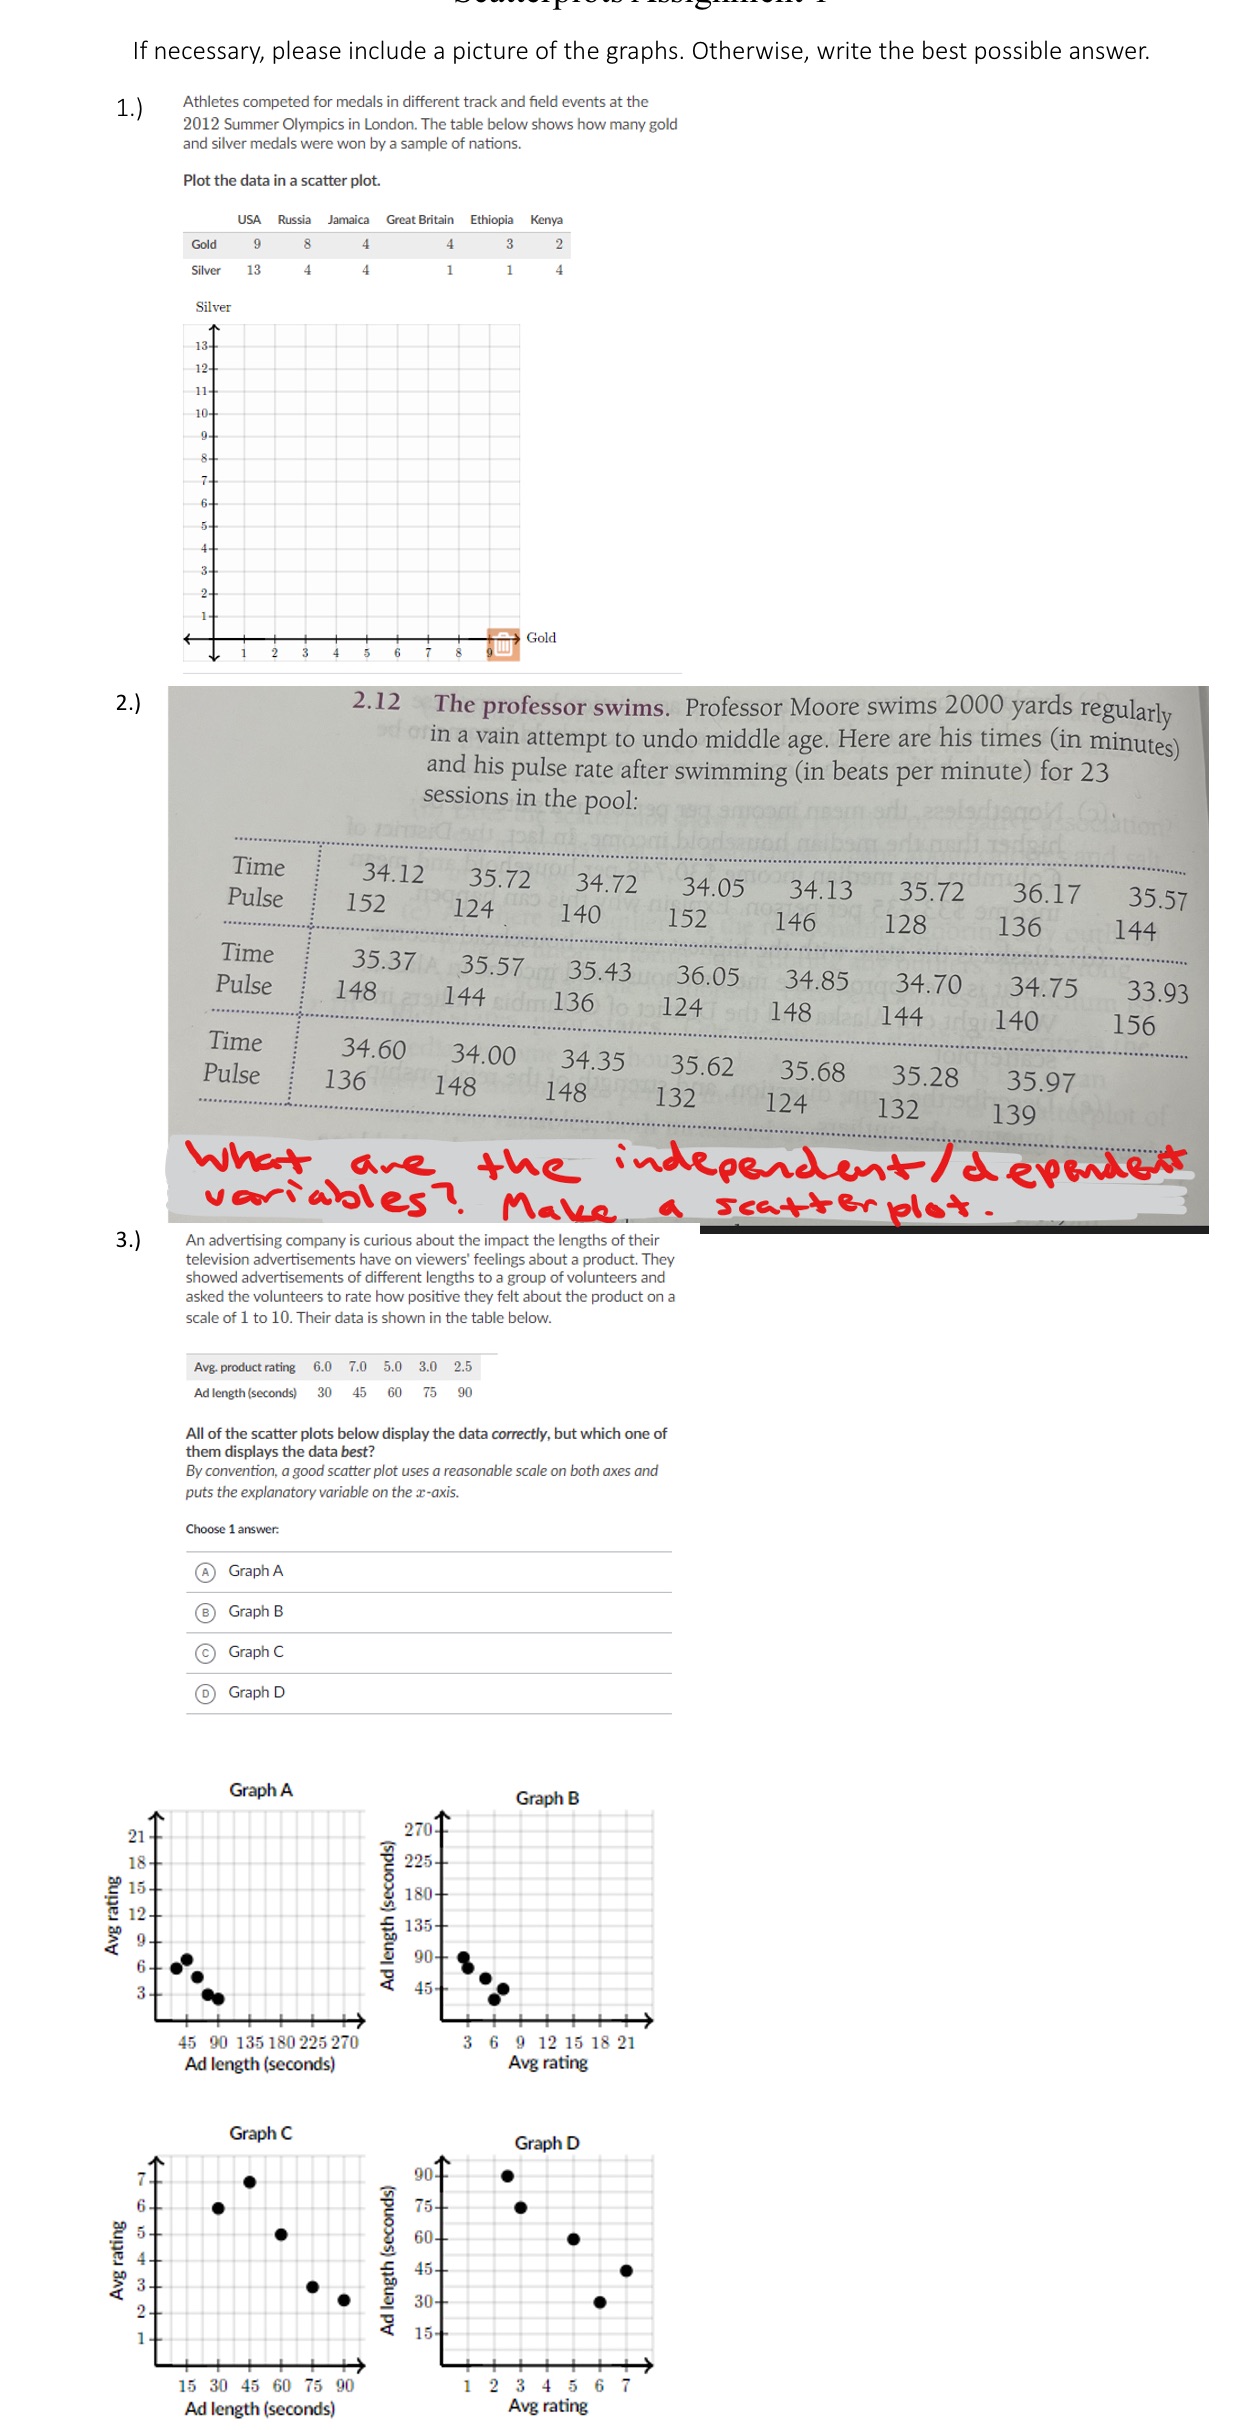
image text in transcribed
If necessary, please include a picture of the graphs. Otherwise, write the best possible answer. 1.) Athletes competed for medals in different track and field events at the 2012 Summer Olympics in London. The table below shows how many gold and silver medals were won by a sample of nations. Plot the data in a scatter plot. USA Russia Jamaica Great Britain Ethiopia Kenya Gold 9 3 2 Silver 13 Silver 13- 12- 10- Gold 2 . ) 2.12 The professor swims. Professor Moore swims 2000 yards regularly in a vain attempt to undo middle age. Here are his times (in minutes) and his pulse rate after swimming (in beats per minute) for 23 sessions in the pool: Time 34.12 35.72 34.72 34.05 34.13 Pulse 35.72 36.17 35.57 152 124 140 152 146 128 136 144 Time 35.37 A 35.57 35.43 36.05 Pulse 34.85 148 34.70 34.75 33.93 144 136 124 148 144 140 156 Time 34.60 34.00 34.35 Pulse 35.62 35.68 136 35.28 148 35.97 148 ..... 132 124 132 139 What are the independent / dependent variables ! Make a scatter plot. 3. ) An advertising company is curious about the impact the lengths of their television advertisements have on viewers' feelings about a product. They showed advertisements of different lengths to a group of volunteers and asked the volunteers to rate how positive they felt about the product on a scale of 1 to 10. Their data is shown in the table below. Avg. product rating 6.0 7.0 5.0 3.0 2.5 Ad length (seconds) 30 45 60 7 75 90 All of the scatter plots below display the data correctly, but which one of them displays the data best? By convention, a good scatter plot uses a reasonable scale on both axes and puts the explanatory variable on the x-axis. Choose 1 answer. A Graph A Graph B Graph C Graph D Graph A Graph B 270 225- 180- Ad length (seconds) Avg rating 135- 90 45 15 90 135 180 225 270 3 6 9 12 15 18 21 Ad length (seconds) Avg rating Graph C Graph D 90- 75- 60- Ad length (seconds) Avg rating 45- 30- 15- 15 30 45 60 75 90 1 2 3 4 5 6 7 Ad length (seconds) Avg rating

Step by Step Solution

There are 3 Steps involved in it

Step: 1

blur-text-image

Get Instant Access to Expert-Tailored Solutions

See step-by-step solutions with expert insights and AI powered tools for academic success

Step: 2

blur-text-image

Step: 3

blur-text-image

Ace Your Homework with AI

Get the answers you need in no time with our AI-driven, step-by-step assistance

Get Started

Recommended Textbook for

California Algebra 1 Concepts Skills And Problem Solving

Authors: Berchie Holliday, Gilbert J. Cuevas, Beatrice Luchin, John A. Carter, Daniel Marks

1st Edition

0078778522, 978-0078778520

More Books

Students also viewed these Mathematics questions

Question

=+ What other suppliers would AnheuserBusch have?

Answered: 1 week ago

Question

i need a selution Determine the reactions at the supports

Answered: 1 week ago