

Answered step by step
Verified Expert Solution
Question
1 Approved Answer
If one of the experts could get back to me as soon as possible that would be greatly appreciated! Purchasing Power Parity Forecasts. Use the
If one of the experts could get back to me as soon as possible that would be greatly appreciated!
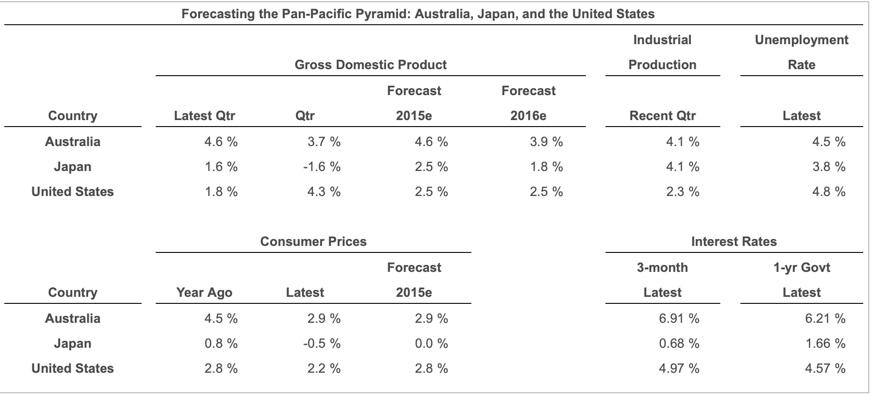
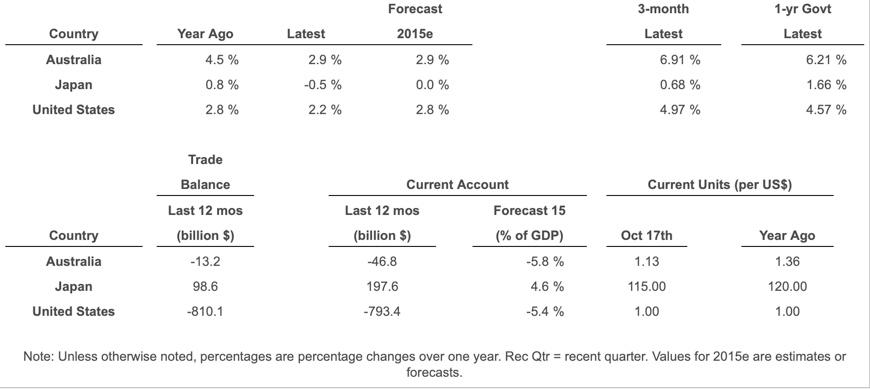
Purchasing Power Parity Forecasts. Use the table containing economic, financial, and business indicators to answer the following questions. Assuming purchasing power parity, and assuming that the forecasted change in consumer prices is a good proxy of predicted inflation, forecast the following exchange rates: a. Japanese yen/U.S. dollar in one year b. Japanese yen/Australian dollar in one year c. Australian dollar/U.S. dollar in one year Assuming purchasing power parity, and assuming that the forecasted change in consumer prices is a good proxy of predicted inflation, forecast the following exchange rates: a. Japanese yen/U.S. dollar in one year The forecast of the spot rate for Japanese yen/U.S. dollar in one year is $. (Round to two decimal places.) Unemployment Rate Forecasting the Pan-Pacific Pyramid: Australia, Japan, and the United States Industrial Gross Domestic Product Production Forecast Forecast Latest Qtr Qtr 2015e 2016 Recent Qtr 4.6 % 3.7 % 4.6% 3.9% 4.1 % 1.6% -1.6 % 2.5% 1.8 % 4.1 % 1.8 % 4.3% 2.5 % 2.5 % 2.3 % Latest 4.5 % Country Australia Japan United States 3.8 % 4.8 % Consumer Prices Country Australia Japan United States Year Ago 4.5% 0.8 % Latest 2.9% -0.5 % Forecast 2015e 2.9% 0.0 % Interest Rates 3-month 1-yr Govt Latest Latest 6.91 % 6.21 % 0.68 % 1.66% 2.8 % 2.2 % 2.8 % 4.97 % 4.57 % Country Australia Japan United States Year Ago 4.5% 0.8 % 2.8 % Latest 2.9% -0.5% Forecast 2015e 2.9% 0.0 % 2.8 % 3-month Latest 6.91 % 0.68 % 4.97 % 1-yr Govt Latest 6.21 % 1.66% 4.57 % 2.2 % Current Units (per US$) Country Australia Japan United States Trade Balance Last 12 mos (billion $) -13.2 98.6 -810.1 Current Account Last 12 mos Forecast 15 (billion $) (% of GDP) -46.8 -5.8 % 197.6 4.6 % -793.4 -5.4 % Oct 17th 1.13 115.00 1.00 Year Ago 1.36 120.00 1.00 Note: Unless otherwise noted, percentages are percentage changes over one year. Rec Qtr = recent quarter. Values for 2015e are estimates or forecasts. Purchasing Power Parity Forecasts. Use the table containing economic, financial, and business indicators to answer the following questions. Assuming purchasing power parity, and assuming that the forecasted change in consumer prices is a good proxy of predicted inflation, forecast the following exchange rates: a. Japanese yen/U.S. dollar in one year b. Japanese yen/Australian dollar in one year c. Australian dollar/U.S. dollar in one year Assuming purchasing power parity, and assuming that the forecasted change in consumer prices is a good proxy of predicted inflation, forecast the following exchange rates: a. Japanese yen/U.S. dollar in one year The forecast of the spot rate for Japanese yen/U.S. dollar in one year is $. (Round to two decimal places.) Unemployment Rate Forecasting the Pan-Pacific Pyramid: Australia, Japan, and the United States Industrial Gross Domestic Product Production Forecast Forecast Latest Qtr Qtr 2015e 2016 Recent Qtr 4.6 % 3.7 % 4.6% 3.9% 4.1 % 1.6% -1.6 % 2.5% 1.8 % 4.1 % 1.8 % 4.3% 2.5 % 2.5 % 2.3 % Latest 4.5 % Country Australia Japan United States 3.8 % 4.8 % Consumer Prices Country Australia Japan United States Year Ago 4.5% 0.8 % Latest 2.9% -0.5 % Forecast 2015e 2.9% 0.0 % Interest Rates 3-month 1-yr Govt Latest Latest 6.91 % 6.21 % 0.68 % 1.66% 2.8 % 2.2 % 2.8 % 4.97 % 4.57 % Country Australia Japan United States Year Ago 4.5% 0.8 % 2.8 % Latest 2.9% -0.5% Forecast 2015e 2.9% 0.0 % 2.8 % 3-month Latest 6.91 % 0.68 % 4.97 % 1-yr Govt Latest 6.21 % 1.66% 4.57 % 2.2 % Current Units (per US$) Country Australia Japan United States Trade Balance Last 12 mos (billion $) -13.2 98.6 -810.1 Current Account Last 12 mos Forecast 15 (billion $) (% of GDP) -46.8 -5.8 % 197.6 4.6 % -793.4 -5.4 % Oct 17th 1.13 115.00 1.00 Year Ago 1.36 120.00 1.00 Note: Unless otherwise noted, percentages are percentage changes over one year. Rec Qtr = recent quarter. Values for 2015e are estimates or forecastsStep by Step Solution
There are 3 Steps involved in it
Step: 1

Get Instant Access to Expert-Tailored Solutions
See step-by-step solutions with expert insights and AI powered tools for academic success
Step: 2

Step: 3
Ace Your Homework with AI
Get the answers you need in no time with our AI-driven, step-by-step assistance
Get Started
Cash Confident An Entrepreneurs Guide To Creating A Profitable Business
Authors: Melissa Houston
1st Edition
1637586361, 978-1637586365