

Answered step by step
Verified Expert Solution
Question
1 Approved Answer
If possible please note the points on the graph sometimes i have trouble reading that. Thank you for the support 5. Costs in the short
If possible please note the points on the graph sometimes i have trouble reading that. Thank you for the support 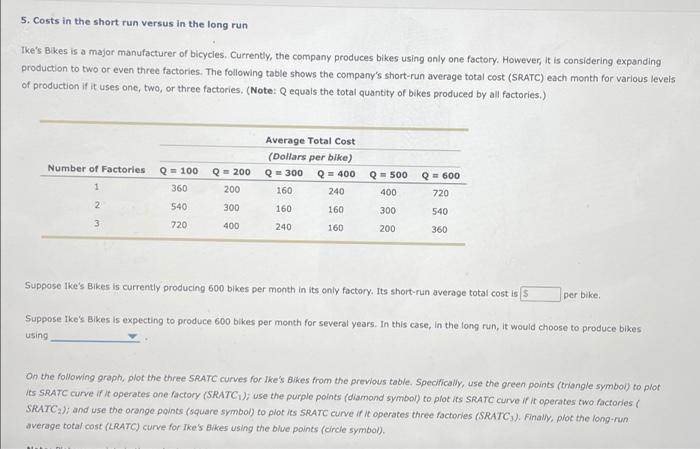
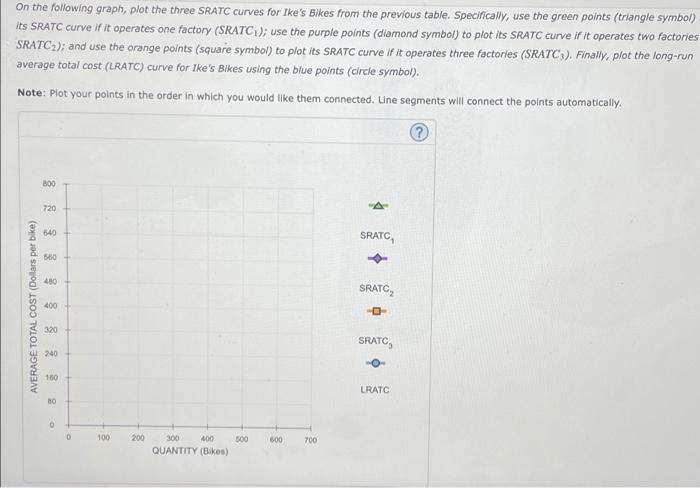
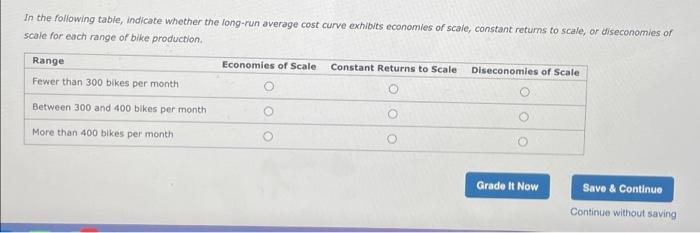
5. Costs in the short run versus in the long run Ike's Bikes is a major manufacturer of bicycles. Currently, the company produces bikes using only one factory. However, it is considering expanding production to two or even three factories. The following table shows the company's short-run average total cost (SRATC) each month for various levels of production if it uses one, two, or three factories. (Note: Qequals the total quantity of bikes produced by all factories.) Number of factories Average Total Cost (Dollars per bike) Q = 300 Q = 400 160 240 Q500 Q=100 360 1 Q = 200 200 300 Q = 600 720 400 2 540 160 160 300 540 3 720 400 240 160 200 360 Suppose Ike's Bikes is currently producing 600 bikes per month in its only factory. Its short-run average total cost is s per bike Suppose Ike's Bikes is expecting to produce 600 bikes per month for several years. In this case, In the long run, it would choose to produce bikes using on the following graph, plot the three SRATC curves for Ike's Bikes from the previous table. Specifically, use the green points (triangle symbol) to plot Its SRATC curve in it operates one factory (SRATC); use the purple points (diamond symbol) to plotits SRATC curve if it operates two factories SRATC); and use the orange points (square symbol) to plotits SRATC curve in it operates three factories (SRATC;). Finally, plot the long run average total cost (LRATC) curve for Ike's Bikes using the blue points (circle symbol). On the following graph, plot the three SRATC curves for Ike's Bikes from the previous table. Specifically, use the green points (triangle symbol) its SRATC curve if it operates one factory (SRATCI); use the purple points (diamond symbol) to plot its SRATC curve if it operates two factories SRATC2); and use the orange points (square symbol) to plot its SRATC curve If it operates three factories (SRATC;). Finally, plot the long-run average total cost (LRATC) curve for Ike's Bikes using the blue points (circle symbol). Note: Plot your points in the order in which you would like them connected. Line segments will connect the points automatically. 800 720 540 SRATC 500 480 SRATC AVERAGE TOTAL COST (Dollars per bike) 400 320 SRATC 240 0 100 LRATC BO 0 100 200 500 600 700 300 400 QUANTITY (Bikes) In the following table, indicate whether the long-run average cost curve exhibits economies of scale, constant returns to scale, or diseconomies of scale for each range of bike production Range Economies of Scale Constant Returns to Scale Diseconomies of Scale Fewer than 300 bikes per month Between 300 and 400 bikes per month More than 400 bikes per month Grade It Now Save & Continue Continue without saving Step by Step Solution
There are 3 Steps involved in it
Step: 1

Get Instant Access to Expert-Tailored Solutions
See step-by-step solutions with expert insights and AI powered tools for academic success
Step: 2

Step: 3
Ace Your Homework with AI
Get the answers you need in no time with our AI-driven, step-by-step assistance
Get Started
Cengage Learnings Online General Ledger For Heintz/parrys College Accounting, 2, 2 Terms (12 Months)
Authors: James A. Heintz, Robert W. Parry
22nd Edition
1305669991, 9781305669994