If someone could answer a,b,c,d, and e, I would greatly appreciate it. Thanks
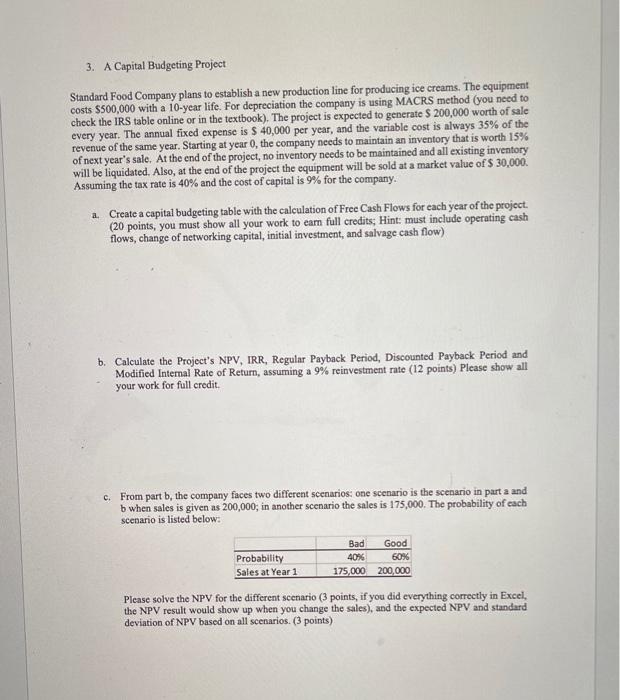
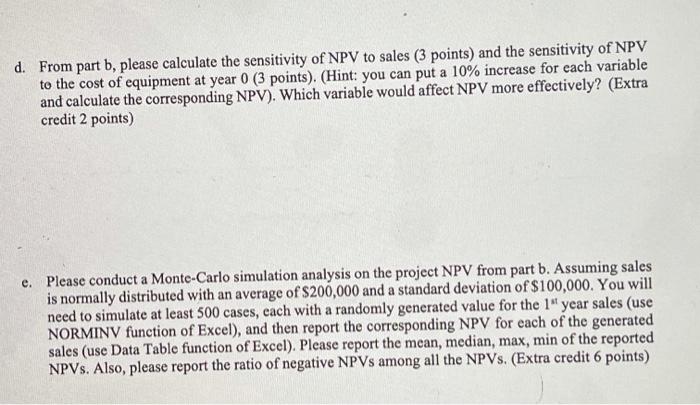
3. A Capital Budgeting Project Standard Food Company plans to establish a new production line for producing ice creams. The equipment costs $500,000 with a 10-year life. For depreciation the company is using MACRS method (you need to check the IRS table online or in the textbook). The project is expected to generate $ 200,000 worth of sale every year. The annual fixed expense is $ 40,000 per year, and the variable cost is always 35% of the revenue of the same year. Starting at year 0, the company needs to maintain an inventory that is worth 15% of next year's sale. At the end of the project, no inventory needs to be maintained and all existing inventory will be liquidated. Also, at the end of the project the equipment will be sold at a market value of $ 30,000. Assuming the tax rate is 40% and the cost of capital is 9% for the company. a. Create a capital budgeting table with the calculation of Free Cash Flows for each year of the project. (20 points, you must show all your work to earn full credits; Hint: must include operating cash flows, change of networking capital, initial investment, and salvage cash flow) . Calculate the Project's NPV, IRR, Regular Payback Period, Discounted Payback Period and Modified Internal Rate of Return, assuming a 9% reinvestment rate (12 points) Please show all your work for full credit. c. From part b, the company faces two different scenarios: one scenario is the scenario in part a and b when sales is given as 200,000, in another scenario the sales is 175,000. The probability of each scenario is listed below: Probability Sales at Year 1 Bad Good 40% 60% 175,000 200,000 Please solve the NPV for the different scenario (3 points, if you did everything correctly in Excel, the NPV result would show up when you change the sales), and the expected NPV and standard deviation of NPV based on all scenarios. (3 points) d. From part b, please calculate the sensitivity of NPV to sales (3 points) and the sensitivity of NPV to the cost of equipment at year 0 (3 points). (Hint: you can put a 10% increase for each variable and calculate the corresponding NPV). Which variable would affect NPV more effectively? (Extra credit 2 points) e. Please conduct a Monte-Carlo simulation analysis on the project NPV from part b. Assuming sales is normally distributed with an average of $200,000 and a standard deviation of $100,000. You will need to simulate at least 500 cases, cach with a randomly generated value for the 1" year sales (use NORMINV function of Excel), and then report the corresponding NPV for each of the generated sales (use Data Table function of Excel). Please report the mean, median, max, min of the reported NPVs. Also, please report the ratio of negative NPVs among all the NPVs. (Extra credit 6 points)


