Answered step by step
Verified Expert Solution
Link Copied!

Question

1 Approved Answer

if the model is bad (fails to predict outcomes better than a constant, and/or predicts very little of the variation in the data) we should

if the model is bad (fails to predict outcomes better than a constant, and/or predicts very little of the variation in the data) we should not look at the regression coefficients. In this case, there would be no evidence that any of the coefficients have other than a zero value. What can you conclude about the suitability of the data for continuing on and looking at regression coefficients? is it worth bothering to even look at the coefficients for Model 5's two analyses? image text in transcribed

Finland 138 4.24(16,121) *** 0.36 0.27 -0.467 ** -0.1976 * (0.107) -0.4595 *** (0.106 -0.0155 (0.101) -0.0606 (0.138) -0.0710 (0.075) -0 584 *** Figure 2-Coefficient table for RQ2-H1 Model 5-Dep. Var.: Problemformulation Perf US/China 191 F (dfModel, dfResid.) 6.24 (19,171) *** R-squared 0.40 Adj. R-squared 0.34 Coeff. (Std. Err.) DominanceBias (0.081) SolutnJumpBias -0.237 *** (0.070) InfoDistortionBias 0.072 (0.068) PerceptualBias InformalIP -0.184 (0.131) HybridIP FormalIP -0.138 (0.102) KnowledgeTacitness -0.036 (0.095) SearchBreadth -0.061 (0.056) Position -0.015 (0.049) FirmAge (0.002) NumberOfEmployees 0.000 (0.000) CountryChinaUS 0.051 (0.156) Manufacturing 107 (0.187) Service -0.040 (0.166) Info Tech -0.215 (0.206) Education -0.374 (0.285) Electronics -0.246 (0.255) Medical -0.019 (0.199) RealEstate -0.057 (0.765) Trade -0.074 (0.268) Consumer GoodsMfg -0.002 -0.0037 (0.003) -0.0001 + (0.000) -0.0179 (0.385) -0.1795 (0.441) -0.0075 (0.456) -0.5513 (0.463) -0.4279 (0.447) 0.1087 (0.426) -0.3020 (0.396) -0.3212 (0.517) 0.1503 (0.508) 0.3539 (0.379) OtherMfgRepairInstall TransportStorage Constant -1.432 *** (0.402) *p<.05 finland figure table for rq2-h1 model var.: problemformulation perf us f dfresid. r-squared adj. coeff. err. dominancebias solutnjumpbias infodistortionbias perceptualbias informalip hybridip formalip knowledgetacitness searchbreadth position firmage numberofemployees countrychinaus manufacturing service info tech education electronics medical realestate trade consumer goodsmfg othermfgrepairinstall transportstorage constant>

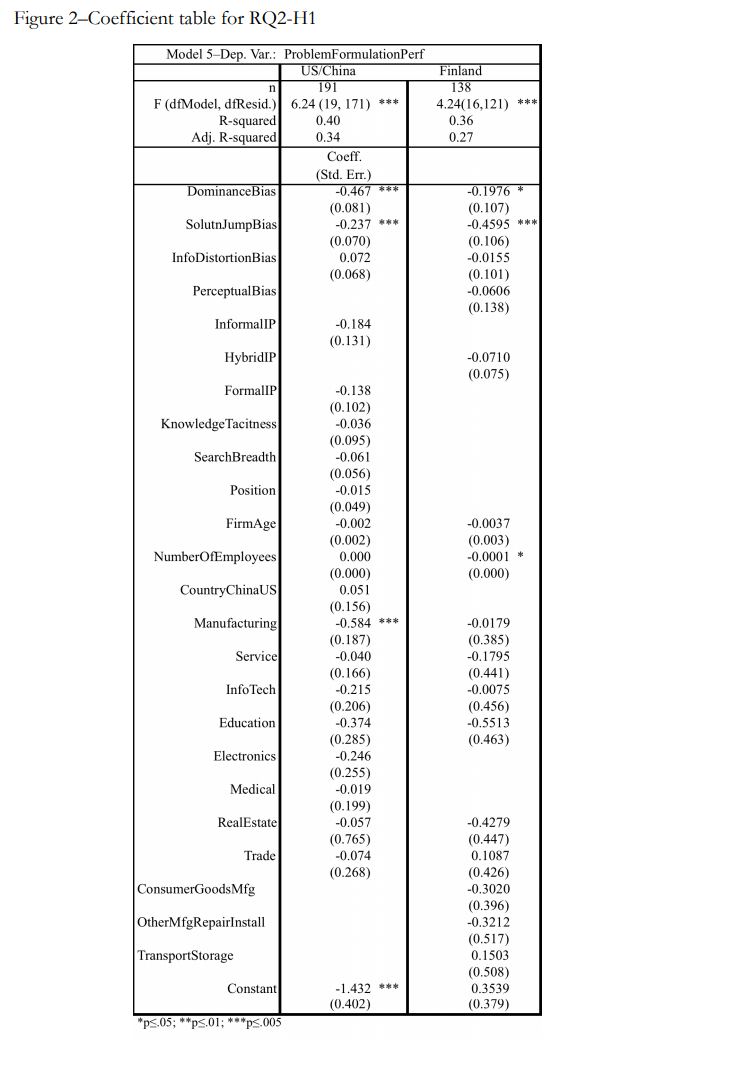
Step by Step Solution

There are 3 Steps involved in it

Step: 1

blur-text-image

Get Instant Access to Expert-Tailored Solutions

See step-by-step solutions with expert insights and AI powered tools for academic success

Step: 2

blur-text-image

Step: 3

blur-text-image

Ace Your Homework with AI

Get the answers you need in no time with our AI-driven, step-by-step assistance

Get Started

Recommended Textbook for

Social Media Audit And Stats Audit And Statistics For Social Media Platforms

Authors: Virtual Desk Tools

1st Edition

B09JDX8Z9M, 979-8492994938

More Books

Students also viewed these Accounting questions