Answered step by step
Verified Expert Solution
Link Copied!

Question

1 Approved Answer

==================================================================================================================================================================================================================== If the unemployment rate is 4.5% and real GDP grows by 5.2%, the new unemployment rate is %. (Round your response to one decimal

image text in transcribed

====================================================================================================================================================================================================================
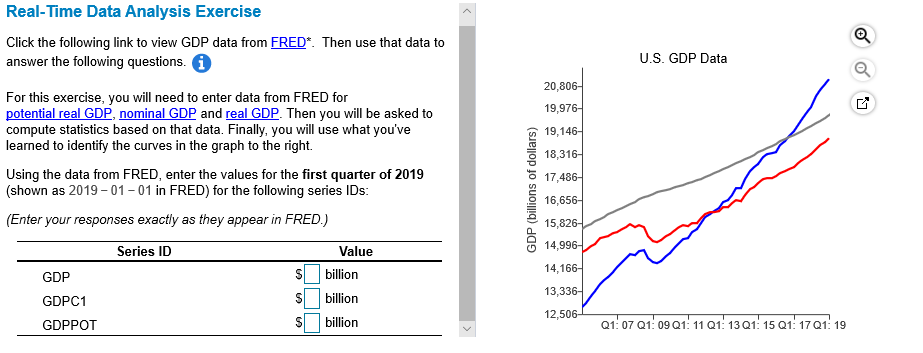
image text in transcribed

If the unemployment rate is 4.5% and real GDP grows by 5.2%, the new unemployment rate is %. (Round your response to one decimal place.) Real-Time Data Analysis Exercise Click the following link to view GDP data from FRED. Then use that data to answer the following questions. U.S. GDP Data 20,806 19,976 19,14 18,316 17,48 16,65 For this exercise, you will need to enter data from FRED for potential real GDP, nominal GDP and real GDP. Then you will be asked to compute statistics based on that data. Finally, you will use what you've learned to identify the curves in the graph to the right. Using the data from FRED, enter the values for the first quarter of 2019 (shown as 2019-01-01 in FRED) for the following series IDs (Enter your responses exactly as they appear in FRED.) e 15,82 O 14,996 Value Series ID 14,16 13,33 12,506 billion Sbilliorn Sbilliorn GDP GDPC1 GDPPOT Q1: 07 Q1:09 Q1: 11 Q1: 13Q1: 15 Q1 17 Q1: 19 If the unemployment rate is 4.5% and real GDP grows by 5.2%, the new unemployment rate is %. (Round your response to one decimal place.) Real-Time Data Analysis Exercise Click the following link to view GDP data from FRED. Then use that data to answer the following questions. U.S. GDP Data 20,806 19,976 19,14 18,316 17,48 16,65 For this exercise, you will need to enter data from FRED for potential real GDP, nominal GDP and real GDP. Then you will be asked to compute statistics based on that data. Finally, you will use what you've learned to identify the curves in the graph to the right. Using the data from FRED, enter the values for the first quarter of 2019 (shown as 2019-01-01 in FRED) for the following series IDs (Enter your responses exactly as they appear in FRED.) e 15,82 O 14,996 Value Series ID 14,16 13,33 12,506 billion Sbilliorn Sbilliorn GDP GDPC1 GDPPOT Q1: 07 Q1:09 Q1: 11 Q1: 13Q1: 15 Q1 17 Q1: 19

Step by Step Solution

There are 3 Steps involved in it

Step: 1

blur-text-image

Get Instant Access to Expert-Tailored Solutions

See step-by-step solutions with expert insights and AI powered tools for academic success

Step: 2

blur-text-image

Step: 3

blur-text-image

Ace Your Homework with AI

Get the answers you need in no time with our AI-driven, step-by-step assistance

Get Started

Recommended Textbook for

Financial Accounting Objective Questions And Explanations

Authors: Irvin N. Gleim

7th Edition

0917539664, 978-0917539664

More Books

Students also viewed these Accounting questions