

Answered step by step
Verified Expert Solution
Question
1 Approved Answer
If we want to insert a new chart into a PowerPoint slide and use our own data, we can click the Insert Chart icon in
If we want to insert a new chart into a PowerPoint slide and use our own data, we can click the Insert Chart icon in the content placeholder, choose the chart type, and then replace the default data with your own data. change the cotor scheme. remove the labels. uplicate the data. 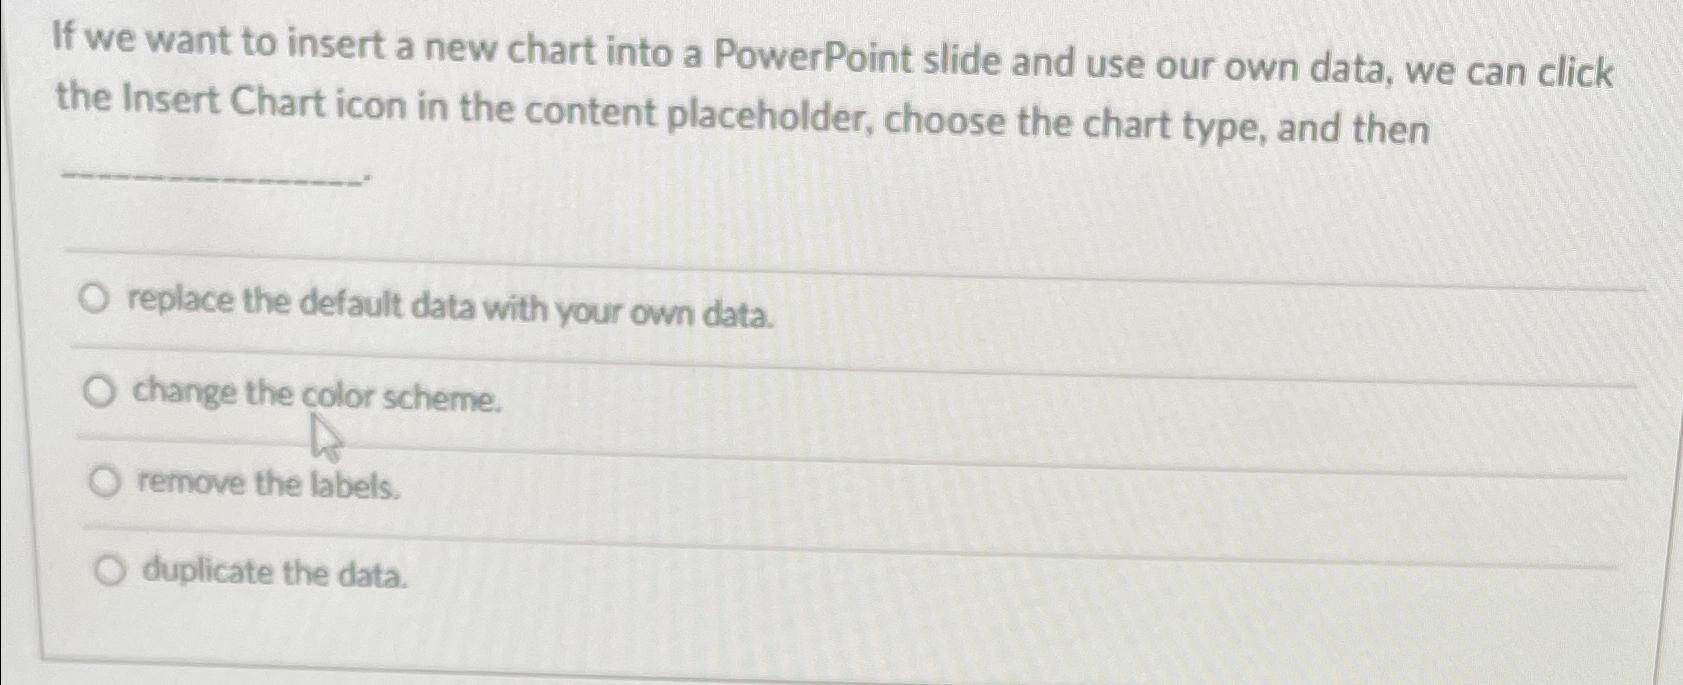
If we want to insert a new chart into a PowerPoint slide and use our own data, we can click the Insert Chart icon in the content placeholder, choose the chart type, and then
replace the default data with your own data.
change the cotor scheme.
remove the labels.
uplicate the data.
Step by Step Solution
There are 3 Steps involved in it
Step: 1

Get Instant Access to Expert-Tailored Solutions
See step-by-step solutions with expert insights and AI powered tools for academic success
Step: 2

Step: 3
Ace Your Homework with AI
Get the answers you need in no time with our AI-driven, step-by-step assistance
Get Started
Apple Watch Series 9 User Guide A Complete Step By Step Instructional Manual For Beginners And Seniors To Setup And Learn How To Use The New Apple Watch Series 9
Authors: Jamie M Kirby
1st Edition
B0CP9RBNQ2, 979-8870348995