Question
If you are an analyst, and your manager asked you to analyse company XYZ using the following financial analysis techniques. The income statement and balance
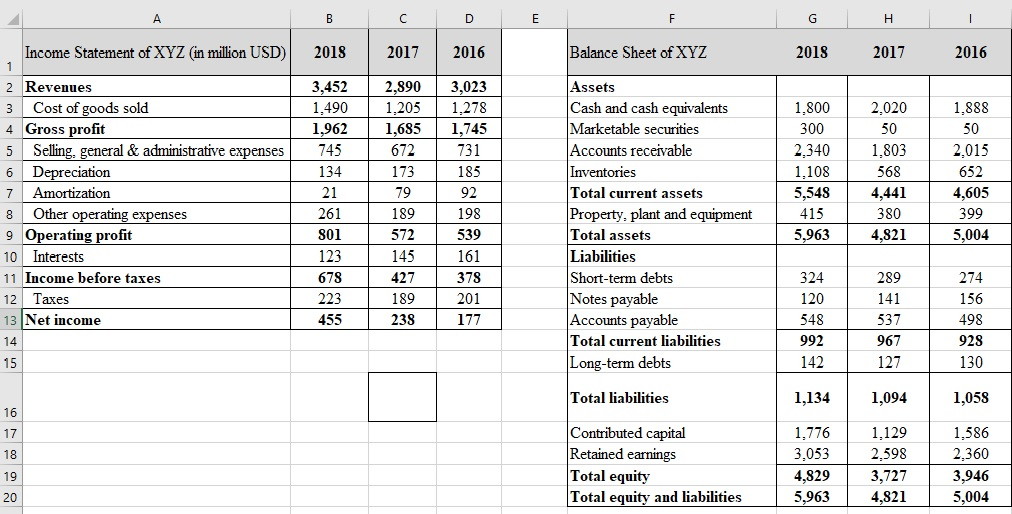
 If you are an analyst, and your manager asked you to analyse company XYZ using the following financial analysis techniques. The income statement and balance sheet of company XYZ are provided in the Excel document. Round off to two (2) decimal points for the financial statement analysis calculation. On top of correctness of the resulting computation and analysis, the tidiness and clarity of your presentation will also be considered in evaluating your answers. (a) Construct a vertical common-size income statement to evaluate the changes in profitability of company XYZ over the three years. Specifically, present the vertical common-size income statement of XYZ in Cell F1:I13 with year 2018, 2017, and 2016 in Column G, H, and I, respectively. Display the formula for Net Income in Cell G14:I14. Based on the vertical common-size income statement, illustrate what contributed to the changes in company XYZs profitability in 2018. From the information, which items on the income statement need further investigation before we can elaborate the change in profitability of XYZ? (10 marks) (b) Based on the balance sheet, calculate the cash ratio, quick ratio and current ratio for 2018, 2017, and 2016. Display the results in cell F17:I20. According to the liquidity ratios above, how well is the ability of company XYZ to pay its short-term debt? (8 marks) (c) For company XYZ, how do the receivables turnover, days of sales outstanding, inventory turnover, and days of inventory on hand change from 2017 to 2018? If the industry norm for receivables turnover and inventory turnover is 1.5 and 1.4, respectively, how efficiently XYZ is managing its assets? Based on the results, determine the possible actions that XYZ can take to boost sales. (7 marks)
Step by Step Solution
There are 3 Steps involved in it
Step: 1

Get Instant Access to Expert-Tailored Solutions
See step-by-step solutions with expert insights and AI powered tools for academic success
Step: 2

Step: 3

Ace Your Homework with AI
Get the answers you need in no time with our AI-driven, step-by-step assistance
Get Started


