If you are having issues viewing, right clicking the images and opening in new tab usually works great. Thank you.
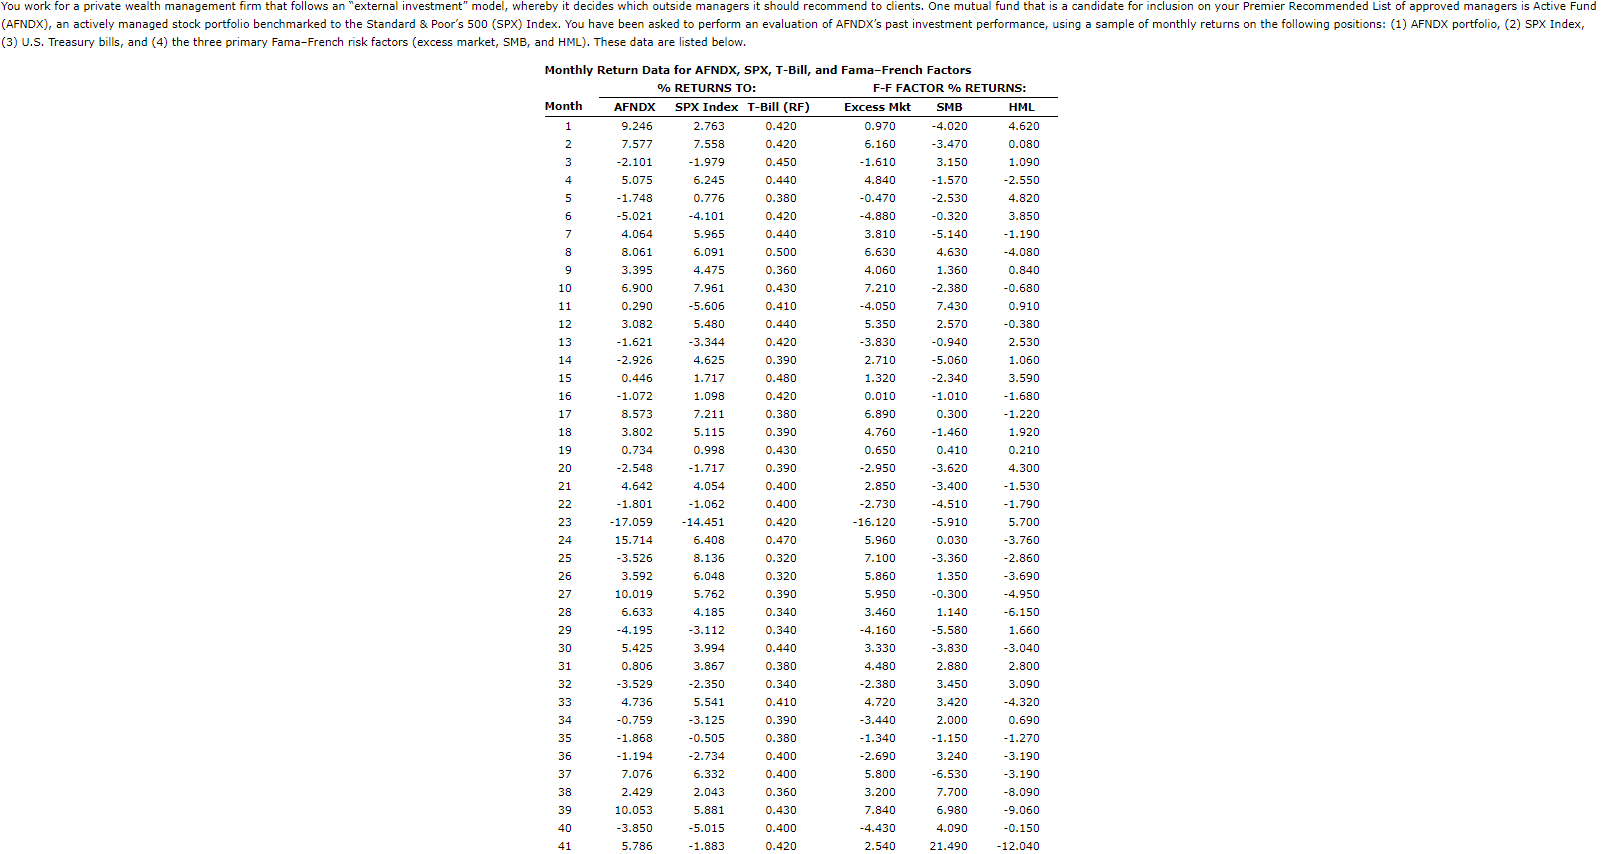
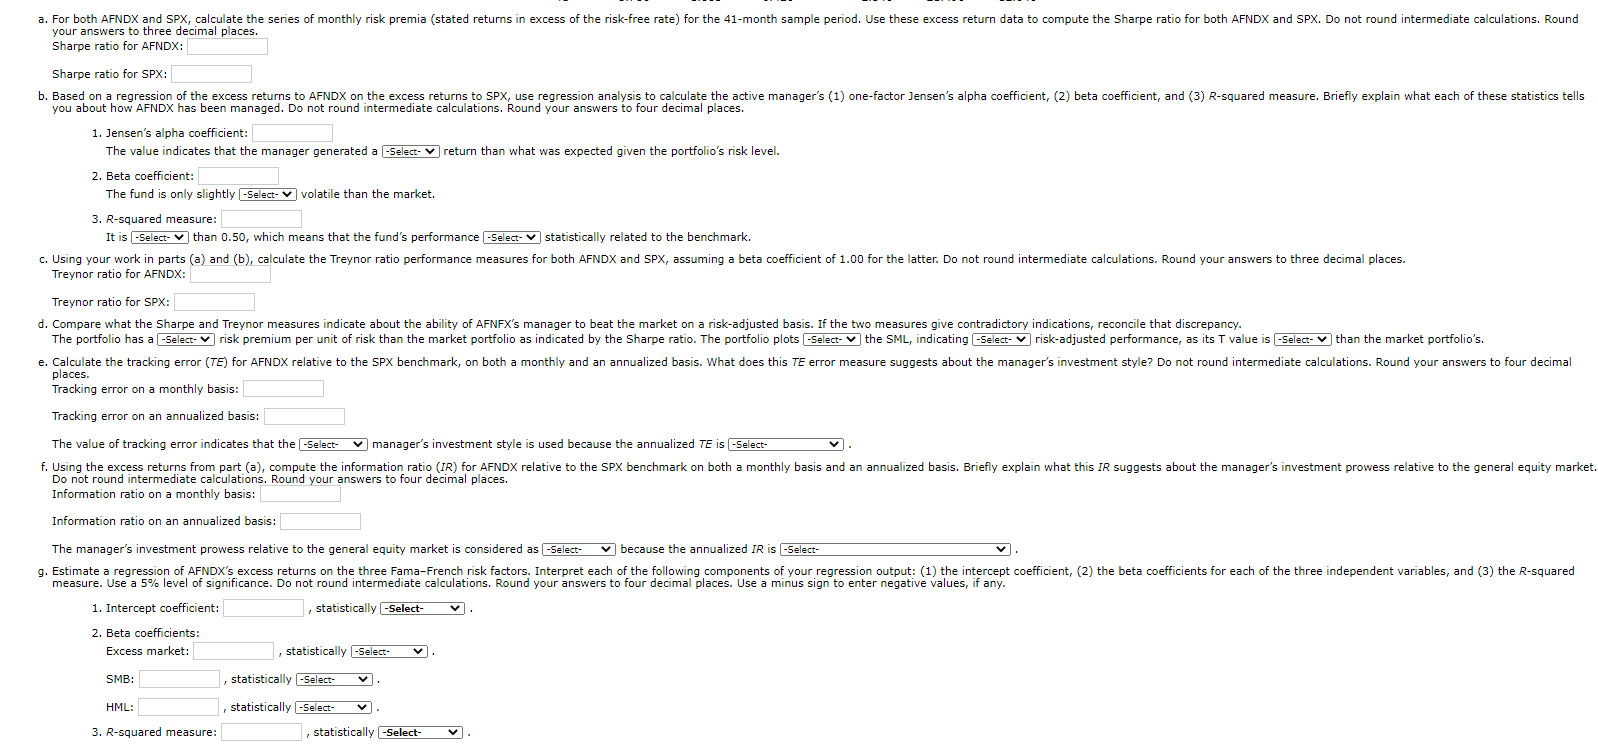
You work for a private wealth management firm that follows an "external investment" model, whereby it decides which outside managers it should recommend to clients. One mutual fund that is a candidate for inclusion on your Premier Recommended List of approved managers is Active Fund (AFNDX), an actively managed stock portfolio benchmarked to the Standard & Poor's 500 (SPX) Index. You have been asked to perform an evaluation of AFNDX's past investment performance, using a sample of monthly returns on the following positions: (1) AFNDX portfolio, (2) SPX Index, (3) U.S. Treasury bills, and (4) the three primary Fama-French risk factors (excess market, SMB, and HML). These data are listed below. Monthly Return Data for AFNDX, SPX, T-Bill, and Fama-French Factors % RETURNS TO: F-F FACTOR % RETURNS: Month AFNDX SPX Index T-Bill (RF) Excess Mkt SMB HML 1 9.246 2.763 0.420 0.970 -4.020 4.620 2 7.577 7.558 0.420 6.160 -3.470 0.080 3 -2.101 -1.979 0.450 -1.610 3.150 1.090 4 5.075 6.245 0.440 4.840 -1.570 -2.550 5 -1.748 0.776 0.380 -0.470 -2.530 4.820 6 -5.021 -4.101 0.420 -4.880 -0.320 3.850 7 4.064 5.965 0.440 3.810 -5.140 -1.190 8 8.061 6.091 0.500 6.630 4.630 -4.080 9 3.395 4.475 0.360 4.060 1.360 0.840 10 6.900 7.961 0.430 7.210 -2.380 -0.680 11 0.290 -5.606 0.410 -4.050 7.430 0.910 12 3.082 5.480 0.440 5.350 2.570 -0.380 13 -1.621 -3.344 0.420 -3.830 -0.940 2.530 14 -2.926 4.625 0.390 2.710 -5.060 1.060 15 0.446 1.717 0.480 1.320 -2.340 3.590 16 -1.072 1.098 0.420 0.010 - 1.010 -1.680 17 8.573 7.211 0.380 6.890 0.300 -1.220 18 3.802 5.115 0.390 4.760 -1.460 1.920 19 0.734 0.998 0.430 0.650 0.410 0.210 20 -2.548 -1.717 0.390 -2.950 -3.620 4.300 21 4.642 4.054 0.400 2.850 -3.400 -1.530 22 -1.801 -1.062 0.400 -2.730 -4.510 -1.790 23 -17.059 -14.451 0.420 - 16.120 -5.910 5.700 24 15.714 6.408 0.470 0.030 -3.760 25 -3.526 8.136 0.320 7.100 -3.360 -2.860 26 3.592 6.048 0.320 5.860 1.350 -3.690 27 10.019 5.762 0.390 5.950 -0.300 -4.950 28 6.633 4.185 0.340 3.460 1.140 -6.150 29 -4.195 -3.112 0.340 -4.160 -5.580 1.660 30 5.425 3.994 0.440 3.330 -3.830 -3.040 31 0.806 3.867 0.380 4.480 2.880 2.800 32 -3.529 -2.350 0.340 -2.380 3.450 3.090 33 4.736 5.541 0.410 4.720 3.420 -4.320 34 -0.759 -3.125 0.390 -3.440 2.000 0.690 35 -1.868 -0.505 0.380 -1.340 -1.150 -1.270 36 -1.194 -2.734 0.400 -2.690 3.240 -3.190 37 7.076 6.332 0.400 5.800 -6.530 -3.190 38 2.429 2.043 0.360 3.200 7.700 -8.090 39 10.053 5.881 0.430 7.840 6.980 -9.060 40 -3.850 -5.015 0.400 -4.430 4.090 -0.150 41 5.786 -1.883 0.420 2.540 21.490 -12.040 5.960 a. For both AFNDX and SPX, calculate the series of monthly risk premia (stated returns in excess of the risk-free rate) for the 41-month sample period. Use these excess return data to compute the Sharpe ratio for both AFNDX and SPX. Do not round intermediate calculations. Round your answers to three decimal places. Sharpe ratio for AFNDX: Sharpe ratio for SPX: b. Based on a regression of the excess returns to AFNDX on the excess returns to SPX, use regression analysis to calculate the active manager's (1) one-factor Jensen's alpha coefficient, (2) beta coefficient, and (3) R-squared measure. Briefly explain what each of these statistics tells you about how AFNDX has been managed. Do not round intermediate calculations. Round your answers to four decimal places. 1. Jensen's alpha coefficient: The value indicates that the manager generated a -Select- V return than what was expected given the portfolio's risk level. 2. Beta coefficient: The fund is only slightly -Select- volatile than the market. 3. R-squared measure: It is -Select- v than 0.50, which means that the fund's performance -Select- statistically related to the benchmark. c. Using your work in parts (a) and (b), calculate the Treynor ratio performance measures for both AFNDX and SPX, assuming a beta coefficient of 1.00 for the latter. Do not round intermediate calculations. Round your answers to three decimal places. Treynor ratio for AFNDX: Treynor ratio for SPX: d. Compare what the Sharpe and Treynor measures indicate about the ability of AFNFX's manager to beat the market on a risk-adjusted basis. If the two measures give contradictory indications, reconcile that discrepancy. The portfolio has a -Select- Vrisk premium per unit of risk than the market portfolio as indicated by the Sharpe ratio. The portfolio plots -Select- the SML, indicating -Select-risk-adjusted performance, as its T value is -Select-than the market portfolio's. e. Calculate the tracking error (TE) for AFNDX relative to the SPX benchmark, on both a monthly and an annualized basis. What does this TE error measure suggests about the manager's investment style? Do not round intermediate calculations. Round your answers to four decimal places. Tracking error on a monthly basis: Tracking error on an annualized basis: The value of tracking error indicates that the -Select- manager's investment style is used because the annualized Te is -Select- f. Using the excess returns from part (a), compute the information ratio (IR) for AFNDX relative to the SPX benchmark on both a monthly basis and an annualized basis. Briefly explain what this IR suggests about the manager's investment prowess relative to the general equity market. Do not round intermediate calculations. Round your answers to four decimal places. Information ratio on a monthly basis: Information ratio on an annualized basis: The manager's investment prowess relative to the general equity market is considered as -Select- because the annualized IR is -Select- g. Estimate a regression of AFNDX's excess returns on the three Fama-French risk factors. Interpret each of the following components of your regression output: (1) the intercept coefficient, (2) the beta coefficients for each of the three independent variables, and (3) the R-squared measure. Use a 5% level of significance. Do not round intermediate calculations. Round your answers to four decimal places. Use a minus sign to enter negative values, if any. 1. Intercept coefficient: statistically -Select- 2. Beta coefficients: Excess market: statistically -Select- SMB: statistically -Select- HML: statistically -Select- 3. R-squared measure: , statistically -Select- You work for a private wealth management firm that follows an "external investment" model, whereby it decides which outside managers it should recommend to clients. One mutual fund that is a candidate for inclusion on your Premier Recommended List of approved managers is Active Fund (AFNDX), an actively managed stock portfolio benchmarked to the Standard & Poor's 500 (SPX) Index. You have been asked to perform an evaluation of AFNDX's past investment performance, using a sample of monthly returns on the following positions: (1) AFNDX portfolio, (2) SPX Index, (3) U.S. Treasury bills, and (4) the three primary Fama-French risk factors (excess market, SMB, and HML). These data are listed below. Monthly Return Data for AFNDX, SPX, T-Bill, and Fama-French Factors % RETURNS TO: F-F FACTOR % RETURNS: Month AFNDX SPX Index T-Bill (RF) Excess Mkt SMB HML 1 9.246 2.763 0.420 0.970 -4.020 4.620 2 7.577 7.558 0.420 6.160 -3.470 0.080 3 -2.101 -1.979 0.450 -1.610 3.150 1.090 4 5.075 6.245 0.440 4.840 -1.570 -2.550 5 -1.748 0.776 0.380 -0.470 -2.530 4.820 6 -5.021 -4.101 0.420 -4.880 -0.320 3.850 7 4.064 5.965 0.440 3.810 -5.140 -1.190 8 8.061 6.091 0.500 6.630 4.630 -4.080 9 3.395 4.475 0.360 4.060 1.360 0.840 10 6.900 7.961 0.430 7.210 -2.380 -0.680 11 0.290 -5.606 0.410 -4.050 7.430 0.910 12 3.082 5.480 0.440 5.350 2.570 -0.380 13 -1.621 -3.344 0.420 -3.830 -0.940 2.530 14 -2.926 4.625 0.390 2.710 -5.060 1.060 15 0.446 1.717 0.480 1.320 -2.340 3.590 16 -1.072 1.098 0.420 0.010 - 1.010 -1.680 17 8.573 7.211 0.380 6.890 0.300 -1.220 18 3.802 5.115 0.390 4.760 -1.460 1.920 19 0.734 0.998 0.430 0.650 0.410 0.210 20 -2.548 -1.717 0.390 -2.950 -3.620 4.300 21 4.642 4.054 0.400 2.850 -3.400 -1.530 22 -1.801 -1.062 0.400 -2.730 -4.510 -1.790 23 -17.059 -14.451 0.420 - 16.120 -5.910 5.700 24 15.714 6.408 0.470 0.030 -3.760 25 -3.526 8.136 0.320 7.100 -3.360 -2.860 26 3.592 6.048 0.320 5.860 1.350 -3.690 27 10.019 5.762 0.390 5.950 -0.300 -4.950 28 6.633 4.185 0.340 3.460 1.140 -6.150 29 -4.195 -3.112 0.340 -4.160 -5.580 1.660 30 5.425 3.994 0.440 3.330 -3.830 -3.040 31 0.806 3.867 0.380 4.480 2.880 2.800 32 -3.529 -2.350 0.340 -2.380 3.450 3.090 33 4.736 5.541 0.410 4.720 3.420 -4.320 34 -0.759 -3.125 0.390 -3.440 2.000 0.690 35 -1.868 -0.505 0.380 -1.340 -1.150 -1.270 36 -1.194 -2.734 0.400 -2.690 3.240 -3.190 37 7.076 6.332 0.400 5.800 -6.530 -3.190 38 2.429 2.043 0.360 3.200 7.700 -8.090 39 10.053 5.881 0.430 7.840 6.980 -9.060 40 -3.850 -5.015 0.400 -4.430 4.090 -0.150 41 5.786 -1.883 0.420 2.540 21.490 -12.040 5.960 a. For both AFNDX and SPX, calculate the series of monthly risk premia (stated returns in excess of the risk-free rate) for the 41-month sample period. Use these excess return data to compute the Sharpe ratio for both AFNDX and SPX. Do not round intermediate calculations. Round your answers to three decimal places. Sharpe ratio for AFNDX: Sharpe ratio for SPX: b. Based on a regression of the excess returns to AFNDX on the excess returns to SPX, use regression analysis to calculate the active manager's (1) one-factor Jensen's alpha coefficient, (2) beta coefficient, and (3) R-squared measure. Briefly explain what each of these statistics tells you about how AFNDX has been managed. Do not round intermediate calculations. Round your answers to four decimal places. 1. Jensen's alpha coefficient: The value indicates that the manager generated a -Select- V return than what was expected given the portfolio's risk level. 2. Beta coefficient: The fund is only slightly -Select- volatile than the market. 3. R-squared measure: It is -Select- v than 0.50, which means that the fund's performance -Select- statistically related to the benchmark. c. Using your work in parts (a) and (b), calculate the Treynor ratio performance measures for both AFNDX and SPX, assuming a beta coefficient of 1.00 for the latter. Do not round intermediate calculations. Round your answers to three decimal places. Treynor ratio for AFNDX: Treynor ratio for SPX: d. Compare what the Sharpe and Treynor measures indicate about the ability of AFNFX's manager to beat the market on a risk-adjusted basis. If the two measures give contradictory indications, reconcile that discrepancy. The portfolio has a -Select- Vrisk premium per unit of risk than the market portfolio as indicated by the Sharpe ratio. The portfolio plots -Select- the SML, indicating -Select-risk-adjusted performance, as its T value is -Select-than the market portfolio's. e. Calculate the tracking error (TE) for AFNDX relative to the SPX benchmark, on both a monthly and an annualized basis. What does this TE error measure suggests about the manager's investment style? Do not round intermediate calculations. Round your answers to four decimal places. Tracking error on a monthly basis: Tracking error on an annualized basis: The value of tracking error indicates that the -Select- manager's investment style is used because the annualized Te is -Select- f. Using the excess returns from part (a), compute the information ratio (IR) for AFNDX relative to the SPX benchmark on both a monthly basis and an annualized basis. Briefly explain what this IR suggests about the manager's investment prowess relative to the general equity market. Do not round intermediate calculations. Round your answers to four decimal places. Information ratio on a monthly basis: Information ratio on an annualized basis: The manager's investment prowess relative to the general equity market is considered as -Select- because the annualized IR is -Select- g. Estimate a regression of AFNDX's excess returns on the three Fama-French risk factors. Interpret each of the following components of your regression output: (1) the intercept coefficient, (2) the beta coefficients for each of the three independent variables, and (3) the R-squared measure. Use a 5% level of significance. Do not round intermediate calculations. Round your answers to four decimal places. Use a minus sign to enter negative values, if any. 1. Intercept coefficient: statistically -Select- 2. Beta coefficients: Excess market: statistically -Select- SMB: statistically -Select- HML: statistically -Select- 3. R-squared measure: , statistically -Select