IF YOU CAN PLEASE CONDUCT ON EXCEL AND SHOW CELL FORMATTING AS I DO NNOT JUST NEED THE ANSWER 

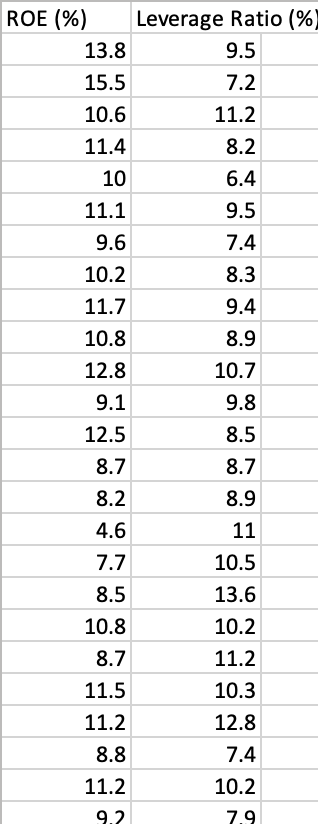
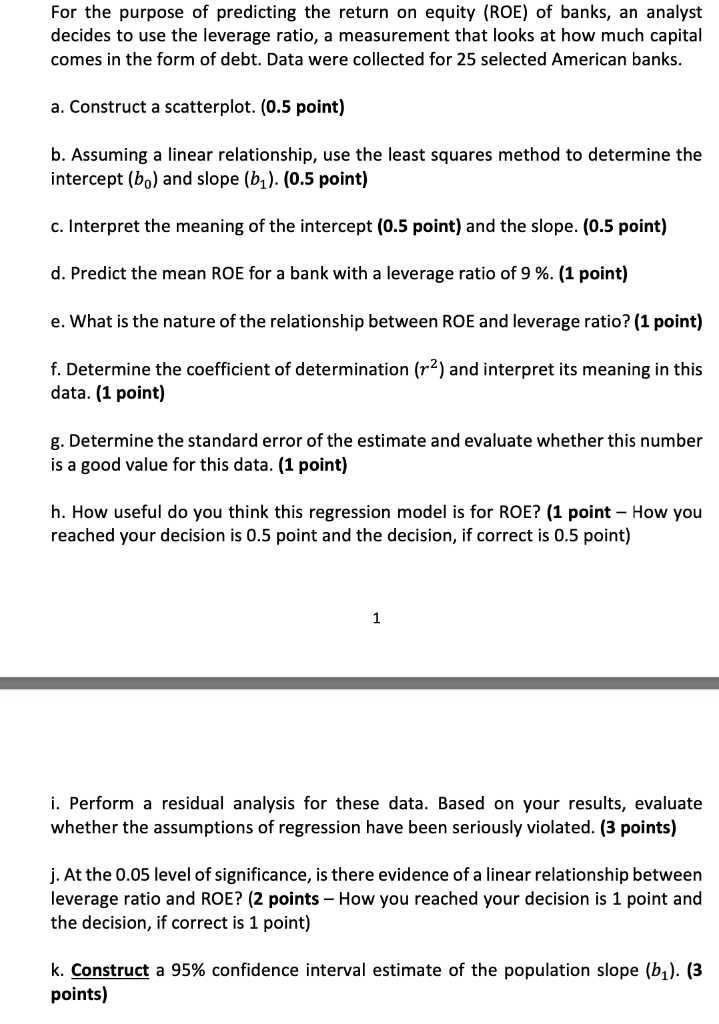
ROE (%) 13.8 Leverage Ratio (% 9.5 7.2 11.2 15.5 10.6 11.4 8.2 10 11.1 6.4 9.5 7.4 9.6 10.2 11.7 8.3 10.8 9.4 8.9 10.7 12.8 9.1 9.8 8.5 12.5 8.7 8.9 8.7 8.2 4.6 7.7 8.5 10.8 11 10.5 13.6 10.2 11.2 10.3 12.8 8.7 11.5 11.2 8.8 7.4 11.2 10.2 9.2 7.9 For the purpose of predicting the return on equity (ROE) of banks, an analyst decides to use the leverage ratio, a measurement that looks at how much capital comes in the form of debt. Data were collected for 25 selected American banks. a. Construct a scatterplot. (0.5 point) b. Assuming a linear relationship, use the least squares method to determine the intercept (bo) and slope (61). (0.5 point) c. Interpret the meaning of the intercept (0.5 point) and the slope. (0.5 point) d. Predict the mean ROE for a bank with a leverage ratio of 9 %. (1 point) e. What is the nature of the relationship between ROE and leverage ratio? (1 point) f. Determine the coefficient of determination (ra) and interpret its meaning in this data. (1 point) g. Determine the standard error of the estimate and evaluate whether this number is a good value for this data. (1 point) h. How useful do you think this regression model is for ROE? (1 point - How you reached your decision is 0.5 point and the decision, if correct is 0.5 point) 1 i. Perform a residual analysis for these data. Based on your results, evaluate whether the assumptions of regression have been seriously violated. (3 points) j. At the 0.05 level of significance, is there evidence of a linear relationship wee leverage ratio and ROE? (2 points - How you reached your decision is 1 point and the decision, if correct is 1 point) k. Construct a 95% confidence interval estimate of the population slope (bz). (3 points) ROE (%) 13.8 Leverage Ratio (% 9.5 7.2 11.2 15.5 10.6 11.4 8.2 10 11.1 6.4 9.5 7.4 9.6 10.2 11.7 8.3 10.8 9.4 8.9 10.7 12.8 9.1 9.8 8.5 12.5 8.7 8.9 8.7 8.2 4.6 7.7 8.5 10.8 11 10.5 13.6 10.2 11.2 10.3 12.8 8.7 11.5 11.2 8.8 7.4 11.2 10.2 9.2 7.9 For the purpose of predicting the return on equity (ROE) of banks, an analyst decides to use the leverage ratio, a measurement that looks at how much capital comes in the form of debt. Data were collected for 25 selected American banks. a. Construct a scatterplot. (0.5 point) b. Assuming a linear relationship, use the least squares method to determine the intercept (bo) and slope (61). (0.5 point) c. Interpret the meaning of the intercept (0.5 point) and the slope. (0.5 point) d. Predict the mean ROE for a bank with a leverage ratio of 9 %. (1 point) e. What is the nature of the relationship between ROE and leverage ratio? (1 point) f. Determine the coefficient of determination (ra) and interpret its meaning in this data. (1 point) g. Determine the standard error of the estimate and evaluate whether this number is a good value for this data. (1 point) h. How useful do you think this regression model is for ROE? (1 point - How you reached your decision is 0.5 point and the decision, if correct is 0.5 point) 1 i. Perform a residual analysis for these data. Based on your results, evaluate whether the assumptions of regression have been seriously violated. (3 points) j. At the 0.05 level of significance, is there evidence of a linear relationship wee leverage ratio and ROE? (2 points - How you reached your decision is 1 point and the decision, if correct is 1 point) k. Construct a 95% confidence interval estimate of the population slope (bz). (3 points)


