Answered step by step
Verified Expert Solution
Question
1 Approved Answer
Ignore the excel functions part. Normal paper calculations required. 1. You own a hotdog stoand in Toronto and need to forecast next year's sales. By
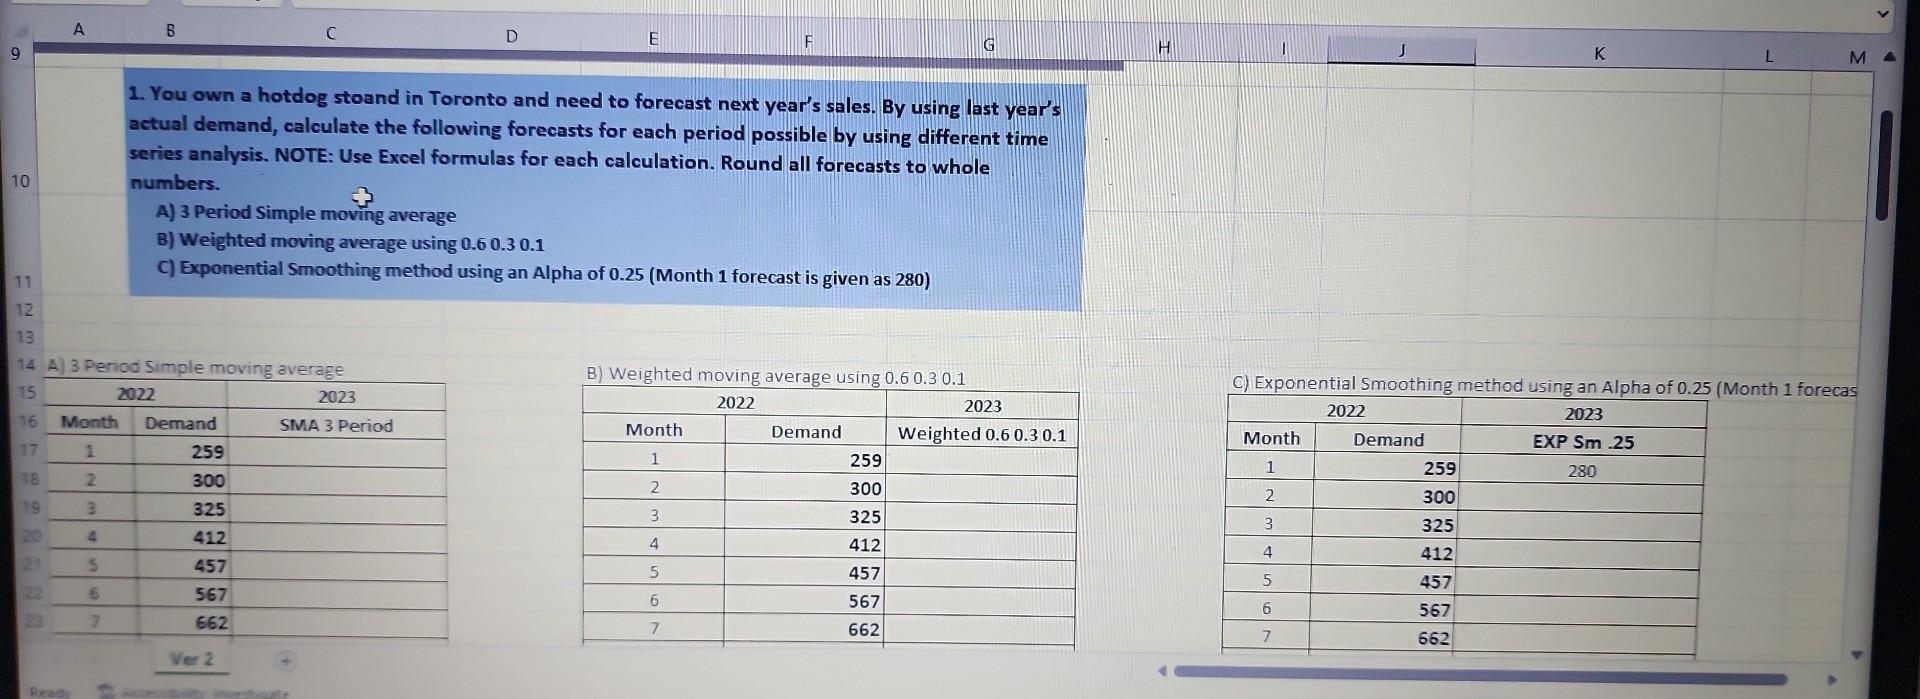

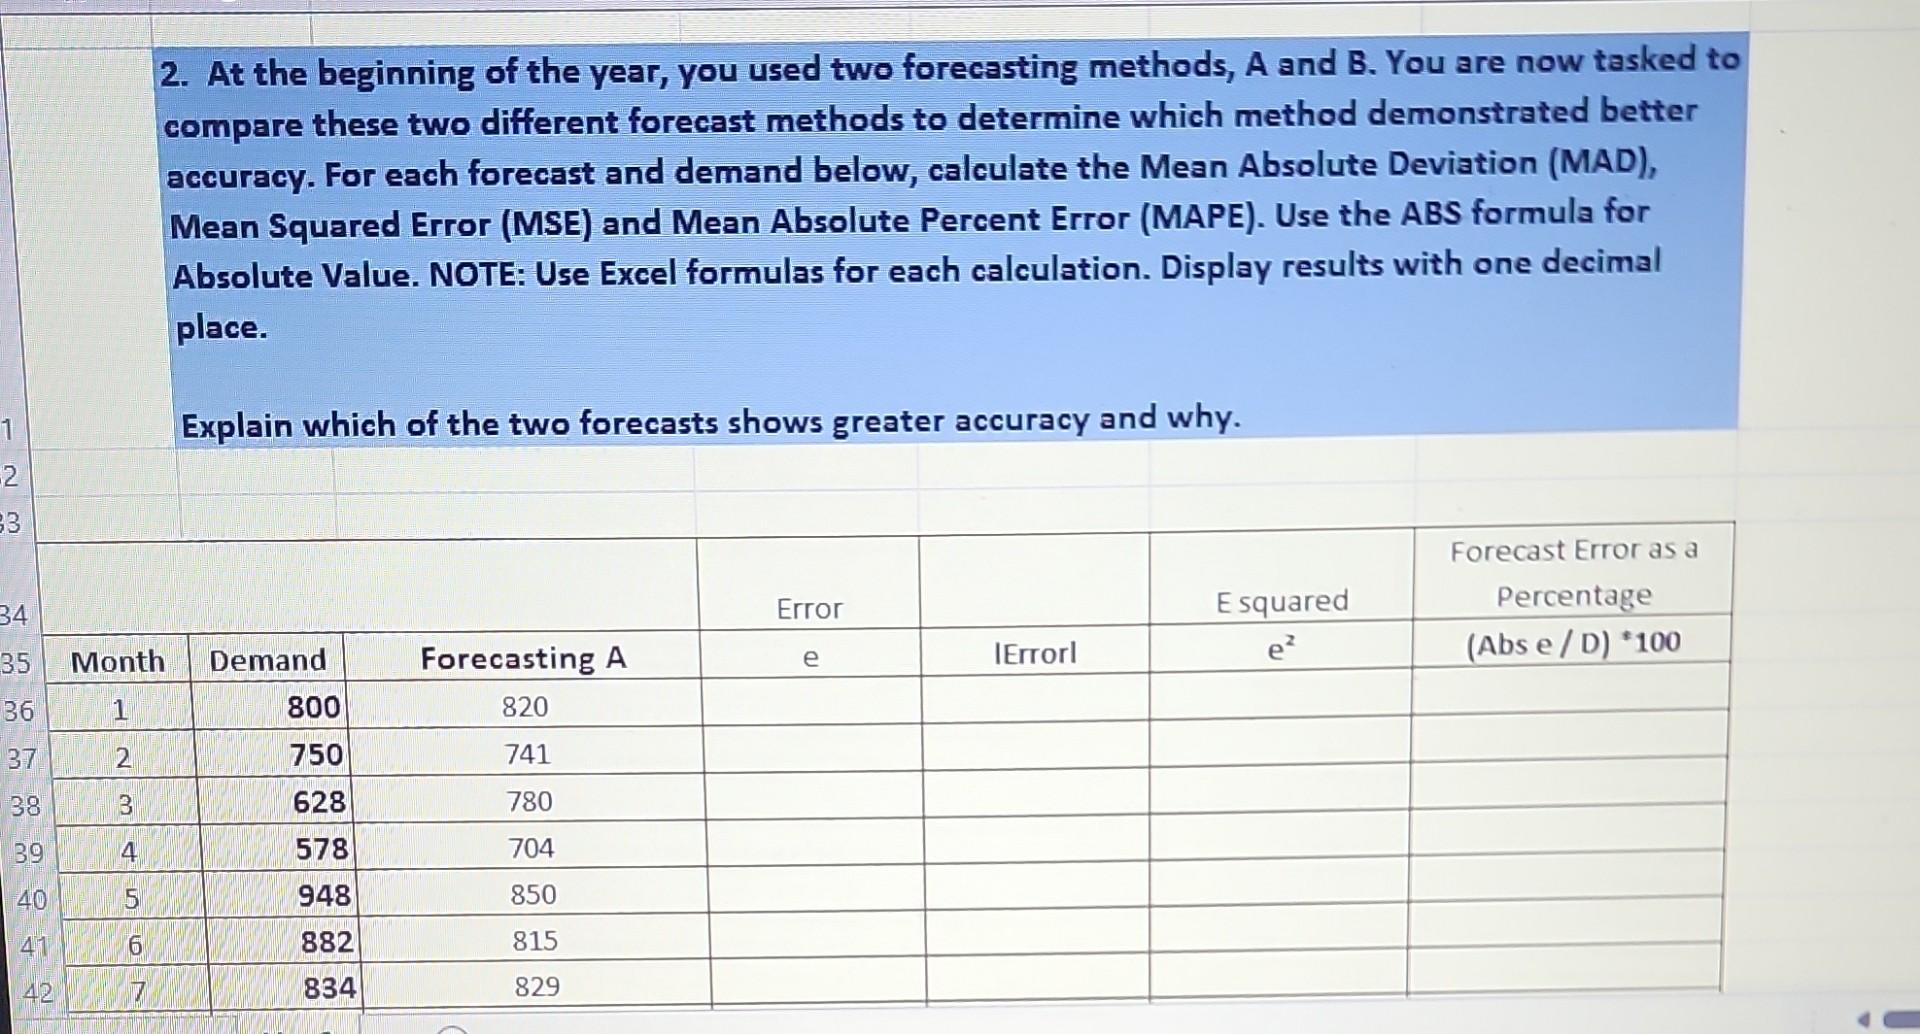
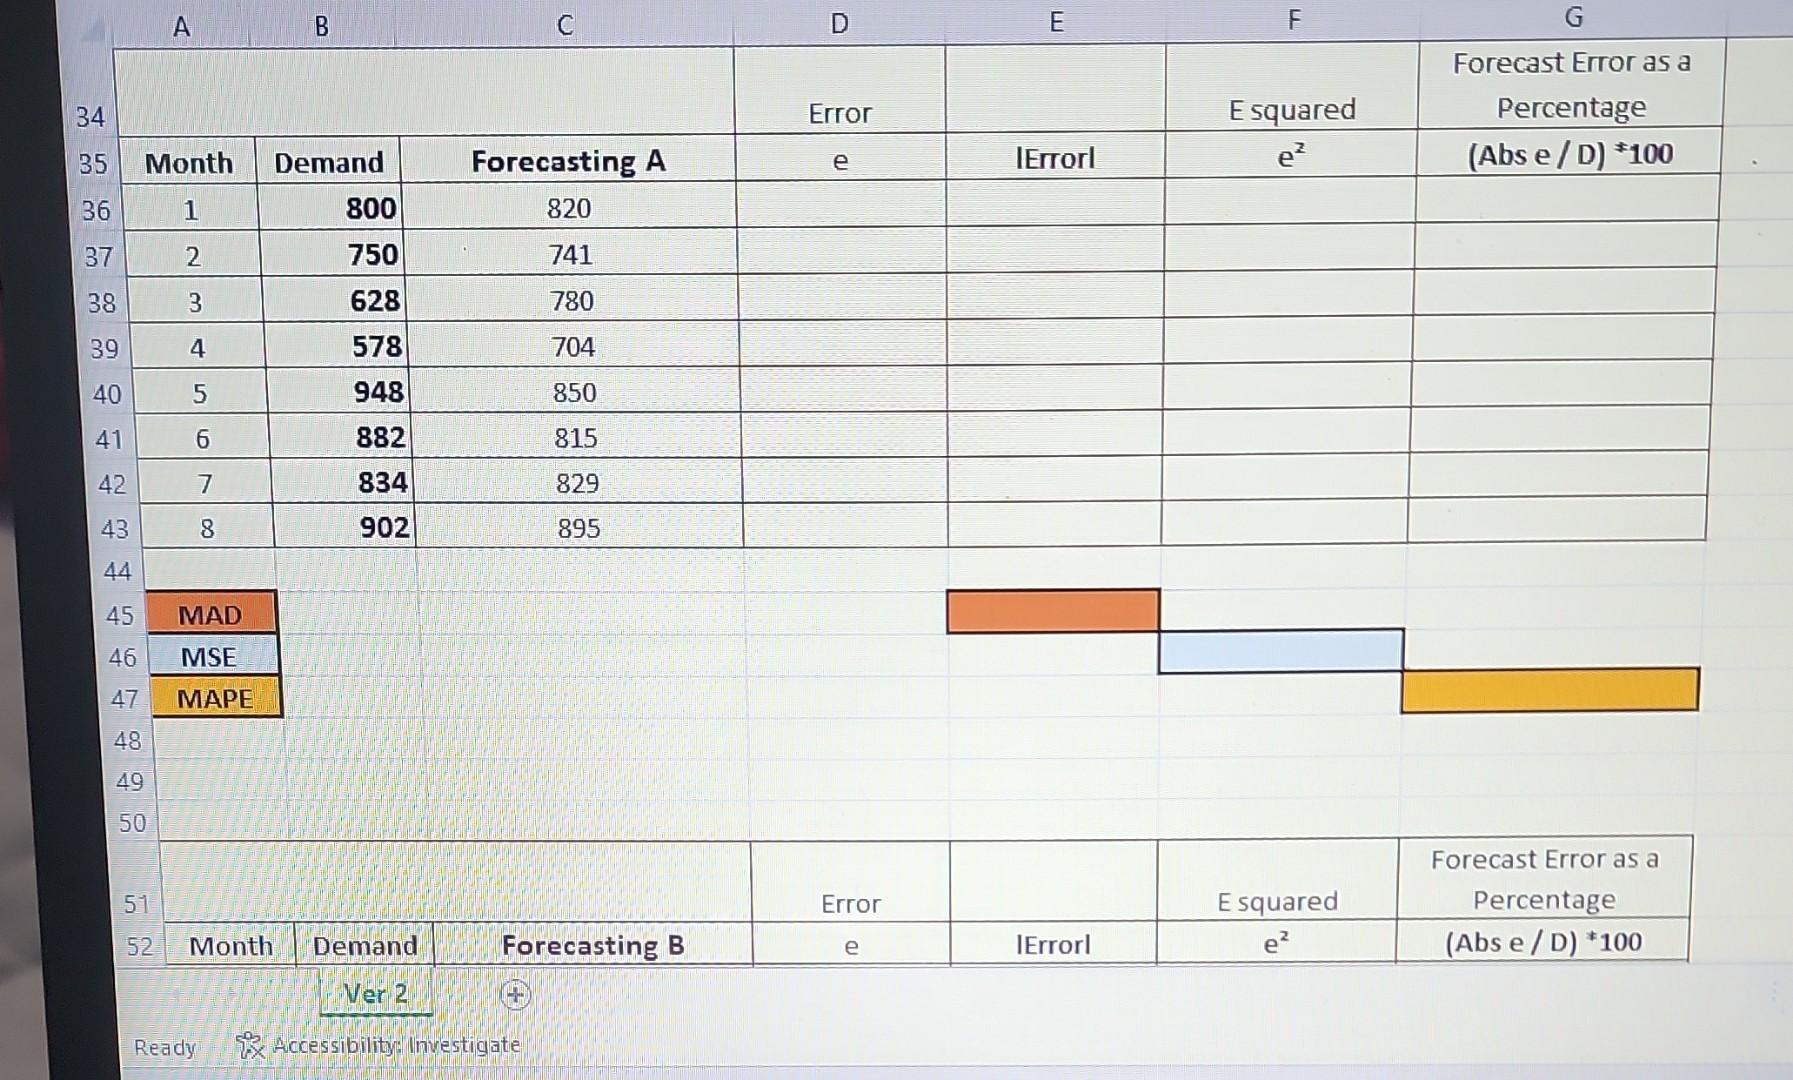
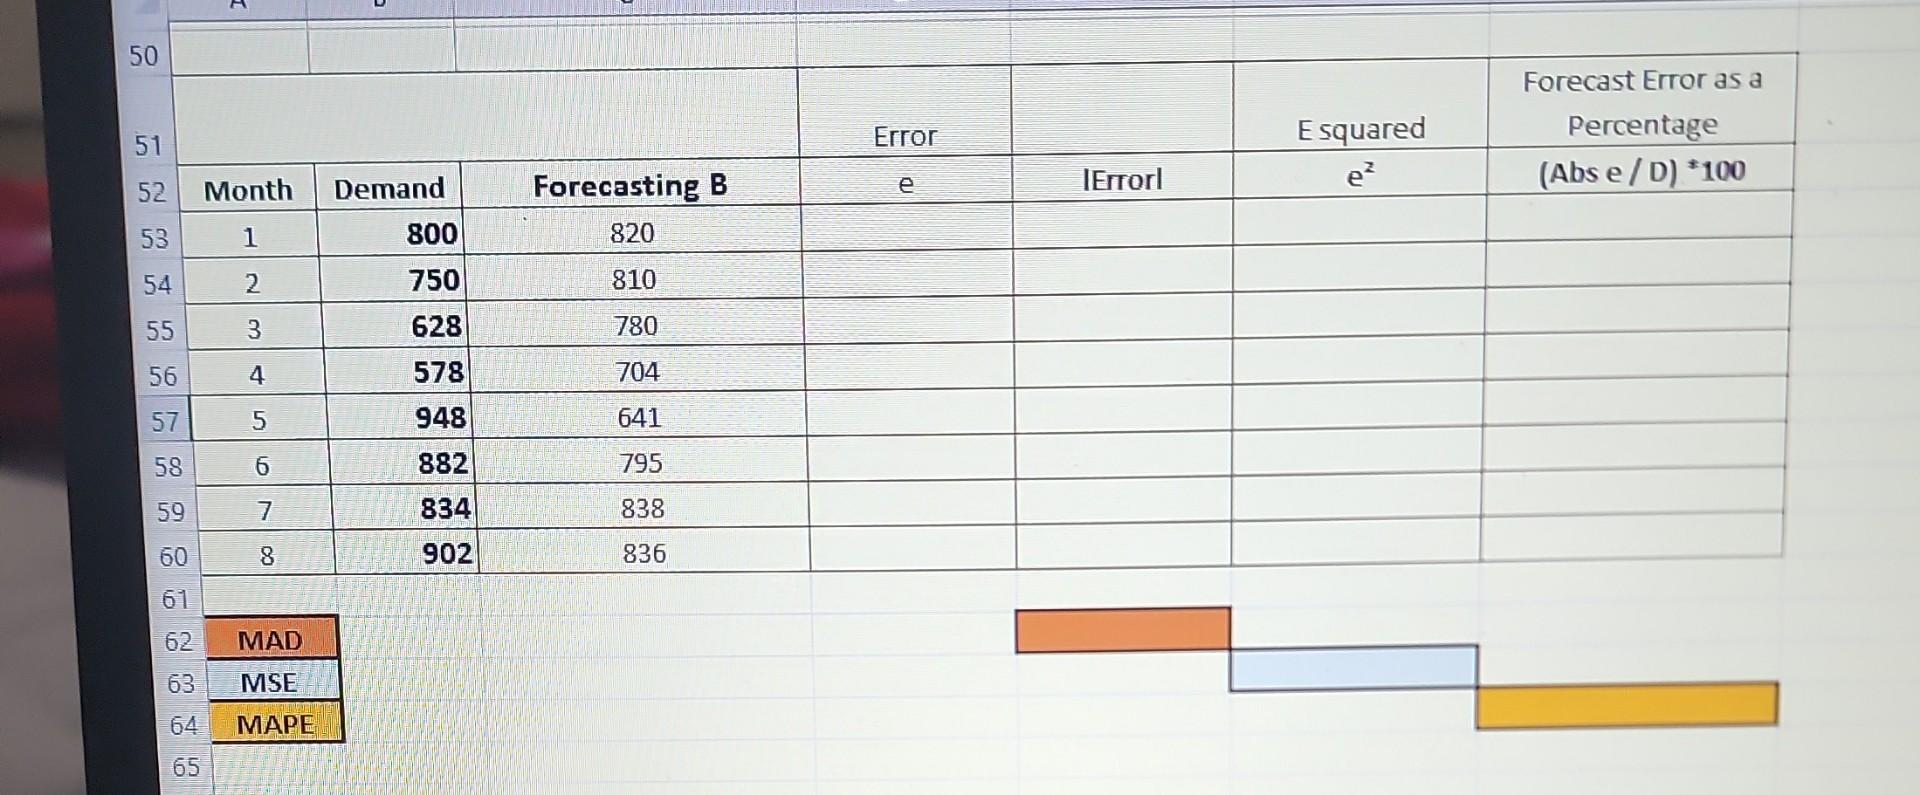
Ignore the excel functions part. Normal paper calculations required.
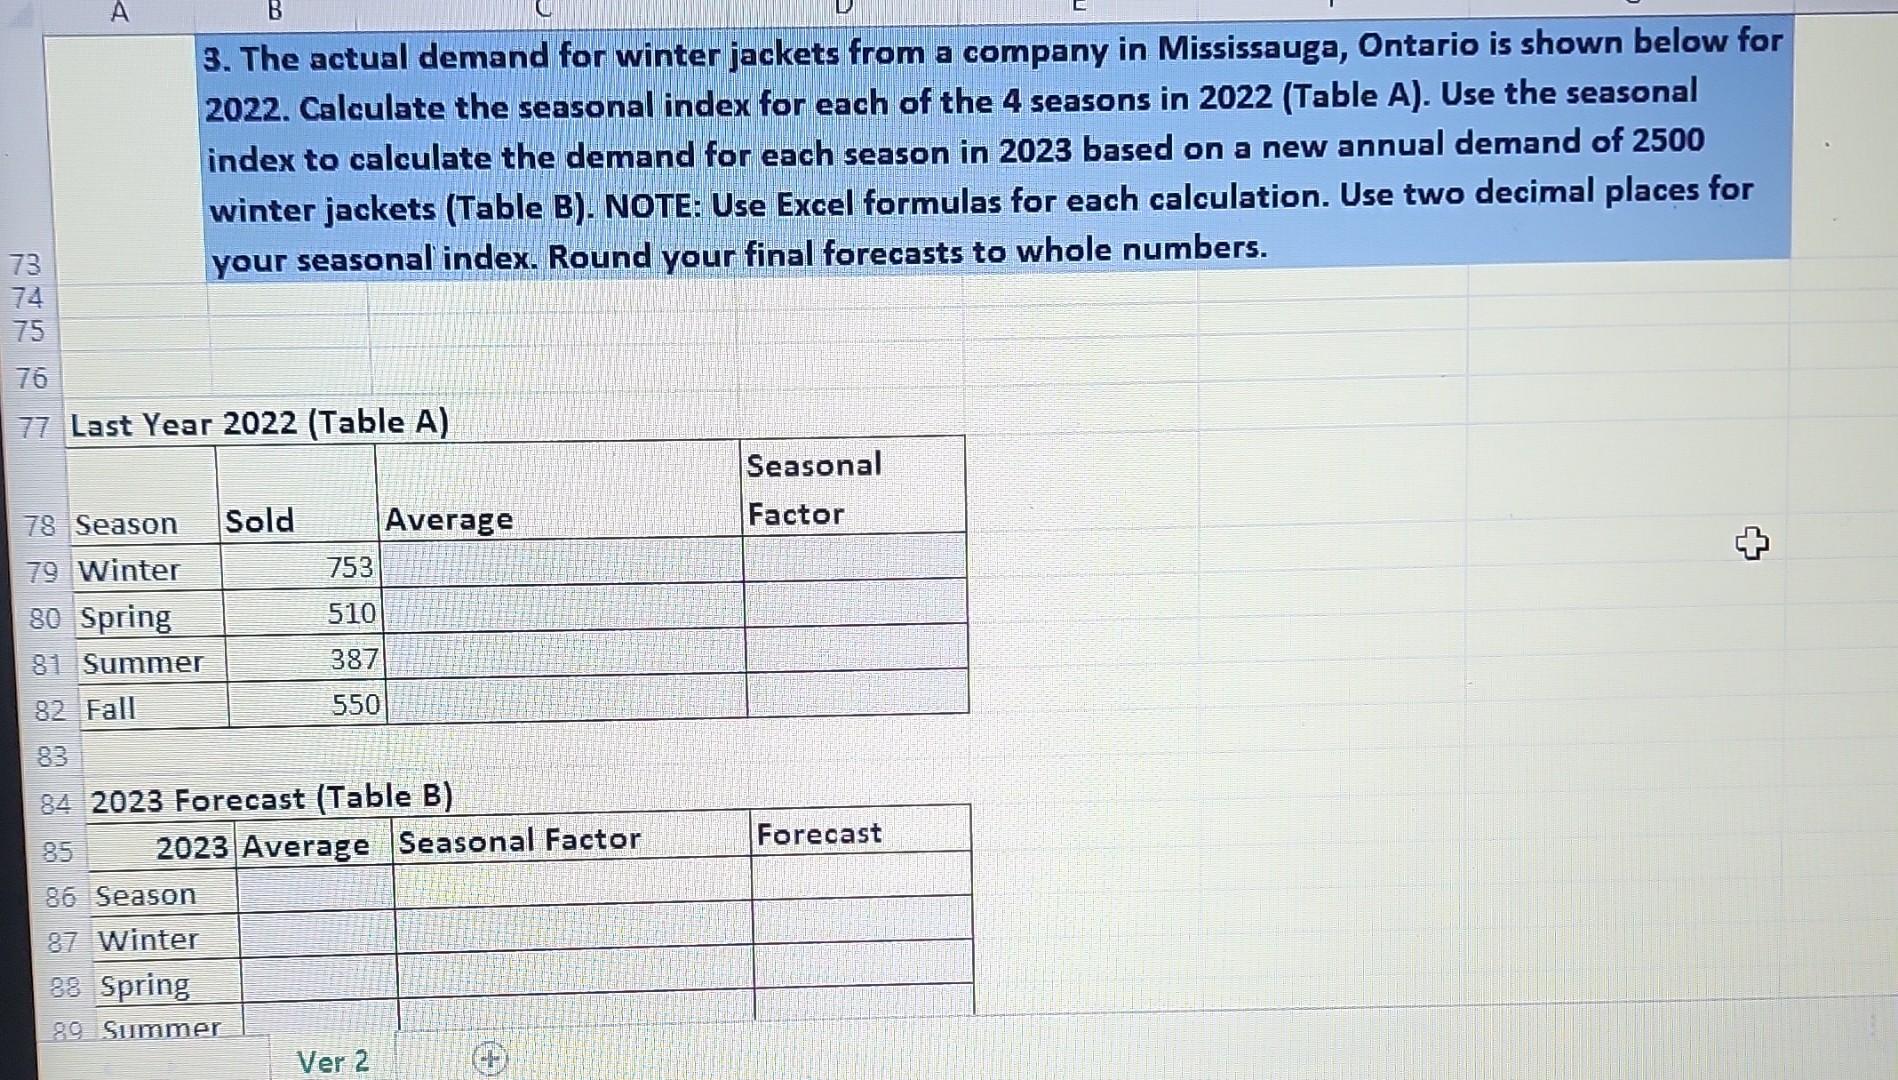
1. You own a hotdog stoand in Toronto and need to forecast next year's sales. By using last year's actual demand, calculate the following forecasts for each period possible by using different time series analysis. NOTE: Use Excel formulas for each calculation. Round all forecasts to whole numbers. A) 3 Period Simple moving average B) Weighted moving average using 0.60.30.1 C) Exponential Smoothing method using an Alpha of 0.25 (Month 1 forecast is given as 280) 4 Al 3 Perind simnle mnvino averado C) Exponential Smoothing method using an Alpha of 0.25 (Month 1 forecas 2. At the beginning of the year, you used two forecasting methods, A and B. You are now tasked to compare these two different forecast methods to determine which method demonstrated better accuracy. For each forecast and demand below, calculate the Mean Absolute Deviation (MAD), Mean Squared Error (MSE) and Mean Absolute Percent Error (MAPE). Use the ABS formula for Absolute Value. NOTE: Use Excel formulas for each calculation. Display results with one decimal place. Explain which of the two forecasts shows greater accuracy and why. \begin{tabular}{|l|l|} \hline 44 & \\ \cline { 2 - 2 } 46 & MAD \\ \hline 47 & MSE \\ \hline 44 MAPE \\ \hline \end{tabular} 48 49 50 51 52. Month Demand \begin{tabular}{|l|l|l} Forecasting B & e & IErrorl \\ \hline \end{tabular} Forecast Error as a Ner 2 (4) Percentage (Abs e / D) 100 Ready Px Accessibility: Investigate 3. The actual demand for winter jackets from a company in Mississauga, Ontario is shown below for 2022. Calculate the seasonal index for each of the 4 seasons in 2022 (Table A). Use the seasonal index to calculate the demand for each season in 2023 based on a new annual demand of 2500 winter jackets (Table B). NOTE: Use Excel formulas for each calculation. Use two decimal places for your seasonal index. Round your final forecasts to whole numbersStep by Step Solution
There are 3 Steps involved in it
Step: 1

Get Instant Access to Expert-Tailored Solutions
See step-by-step solutions with expert insights and AI powered tools for academic success
Step: 2

Step: 3

Ace Your Homework with AI
Get the answers you need in no time with our AI-driven, step-by-step assistance
Get Started


