Answered step by step
Verified Expert Solution
Question
1 Approved Answer
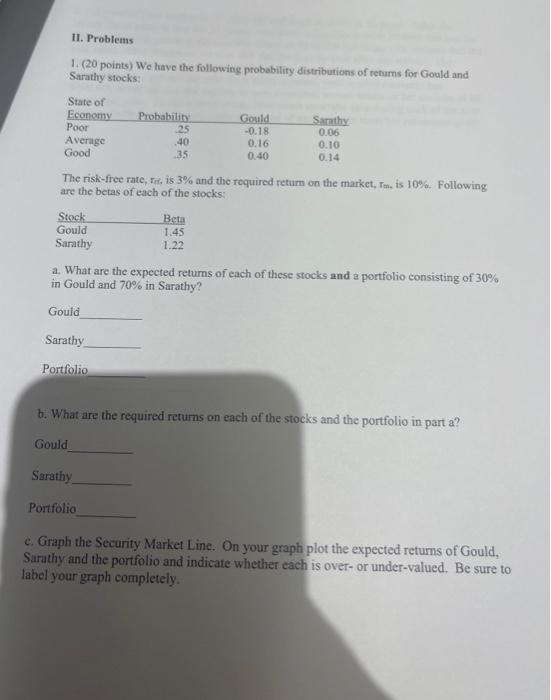
II. Problems 1. (20 points) We have the following probability distributions of returns for Gould and Sarathy stocks: State of Economy Poor Average Good Stock
II. Problems 1. (20 points) We have the following probability distributions of returns for Gould and Sarathy stocks: State of Economy Poor Average Good Stock Gould Sarathy The risk-free rate, Irf, is 3% and the required return on the market, Tm, is 10%. Following are the betas of each of the stocks: Gould Sarathy Portfolio Gould Probability .25 .40 .35 a. What are the expected returns of each of these stocks and a portfolio consisting of 30% in Gould and 70% in Sarathy? Sarathy Gould -0.18 0.16 0.40 Beta 1.45 1.22 Portfolio Sarathy 0.06 0.10 0.14 b. What are the required returns on each of the stocks and the portfolio in part a? c. Graph the Security Market Line. On your graph plot the expected returns of Gould, Sarathy and the portfolio and indicate whether each is over- or under-valued. Be sure to label your graph completely.

Step by Step Solution
There are 3 Steps involved in it
Step: 1

Get Instant Access to Expert-Tailored Solutions
See step-by-step solutions with expert insights and AI powered tools for academic success
Step: 2

Step: 3

Ace Your Homework with AI
Get the answers you need in no time with our AI-driven, step-by-step assistance
Get Started


