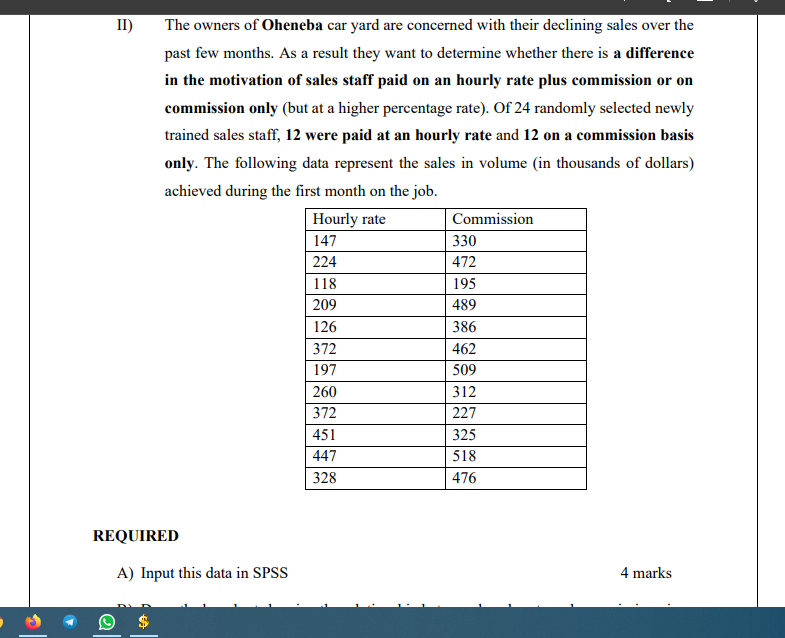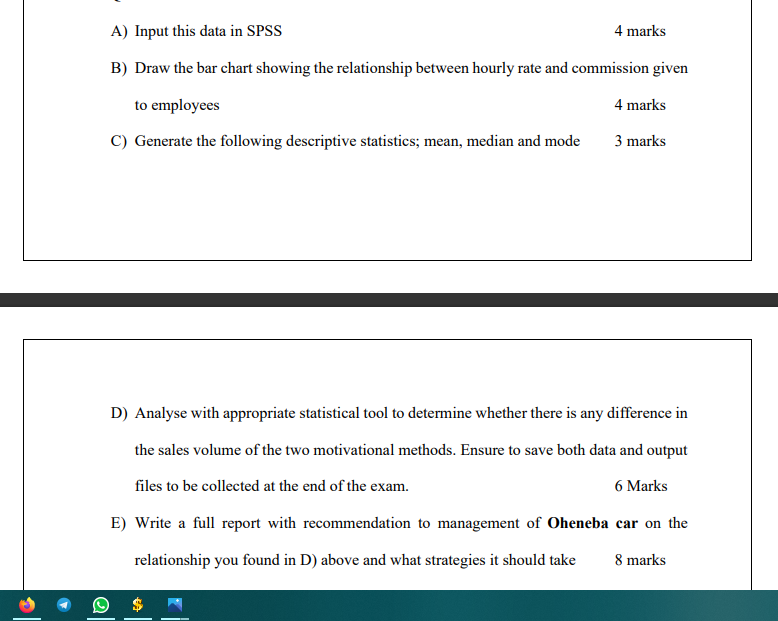

II) The owners of Oheneba car yard are concerned with their declining sales over the past few months. As a result they want to determine whether there is a difference in the motivation of sales staff paid on an hourly rate plus commission or on commission only (but at a higher percentage rate). Of 24 randomly selected newly trained sales staff, 12 were paid at an hourly rate and 12 on a commission basis only. The following data represent the sales in volume (in thousands of dollars) achieved during the first month on the job. Hourly rate Commission 147 330 224 472 118 195 209 489 126 386 372 462 197 509 260 312 372 227 451 325 447 518 328 476 REQUIRED A) Input this data in SPSS 4 marks A) Input this data in SPSS 4 marks B) Draw the bar chart showing the relationship between hourly rate and commission given to employees 4 marks C) Generate the following descriptive statistics; mean, median and mode 3 marks D) Analyse with appropriate statistical tool to determine whether there is any difference in the sales volume of the two motivational methods. Ensure to save both data and output files to be collected at the end of the exam. 6 Marks E) Write a full report with recommendation to management of Oheneba car on the relationship you found in D) above and what strategies it should take 8 marks 5 $ II) The owners of Oheneba car yard are concerned with their declining sales over the past few months. As a result they want to determine whether there is a difference in the motivation of sales staff paid on an hourly rate plus commission or on commission only (but at a higher percentage rate). Of 24 randomly selected newly trained sales staff, 12 were paid at an hourly rate and 12 on a commission basis only. The following data represent the sales in volume (in thousands of dollars) achieved during the first month on the job. Hourly rate Commission 147 330 224 472 118 195 209 489 126 386 372 462 197 509 260 312 372 227 451 325 447 518 328 476 REQUIRED A) Input this data in SPSS 4 marks A) Input this data in SPSS 4 marks B) Draw the bar chart showing the relationship between hourly rate and commission given to employees 4 marks C) Generate the following descriptive statistics; mean, median and mode 3 marks D) Analyse with appropriate statistical tool to determine whether there is any difference in the sales volume of the two motivational methods. Ensure to save both data and output files to be collected at the end of the exam. 6 Marks E) Write a full report with recommendation to management of Oheneba car on the relationship you found in D) above and what strategies it should take 8 marks 5 $


