Answered step by step
Verified Expert Solution
Question
1 Approved Answer
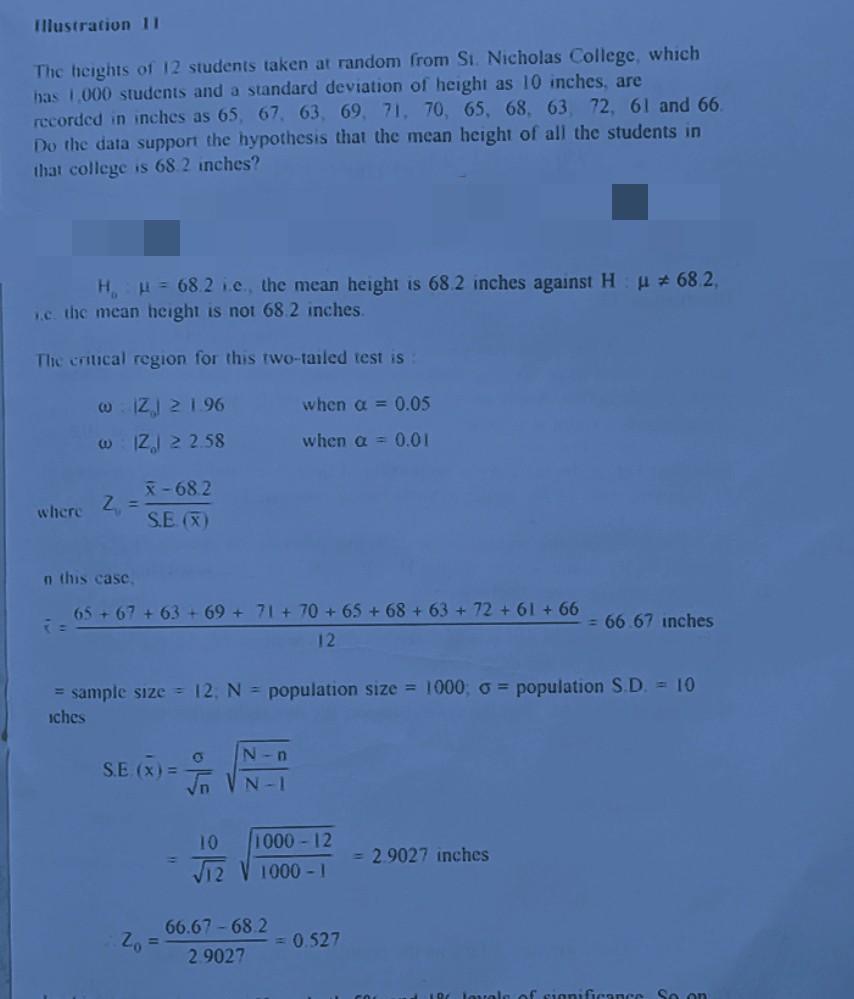
Illustration 11 The heights of 12 students taken at random from St. Nicholas College, which has 1,000 students and a standard deviation of height as

Illustration 11 The heights of 12 students taken at random from St. Nicholas College, which has 1,000 students and a standard deviation of height as 10 inches, are recorded in inches as 65, 67, 63, 69, 71, 70, 65, 68, 63, 72, 61 and 66. Do the data support the hypothesis that the mean height of all the students in that college is 68 2 inches? H = 682 ic. the mean height is 68.2 inches against Hu 68 2, c. the mean height is not 68 2 inches Thic critical region for this two-tailed test is when a = 0.05 WIZI 2196 w 12.12 2.58 when a = 0.01 X-68.2 where 2 = SE(X) n this case 65 +67 +63 +69 + 71 + 70 +65 +68 +63 + 72 +61 + 66 12 = 66 67 inches = sample size = 12 N = population size = 1000, o = population S.D. = 10 sches N- SE (X) = n VN-1 10 1000 - 12 1000 - 1 2.9027 inches 66.67 - 682 Zo = = 0.527 2.9027 Soon
Step by Step Solution
There are 3 Steps involved in it
Step: 1

Get Instant Access to Expert-Tailored Solutions
See step-by-step solutions with expert insights and AI powered tools for academic success
Step: 2

Step: 3

Ace Your Homework with AI
Get the answers you need in no time with our AI-driven, step-by-step assistance
Get Started


