

Answered step by step
Verified Expert Solution
Question
1 Approved Answer
I'm not really sure wwhat I need to do File Home Insert Page Layout Formulas Data Review View Automate Help Christensen, James K. :xfx General
I'm not really sure wwhat I need to do
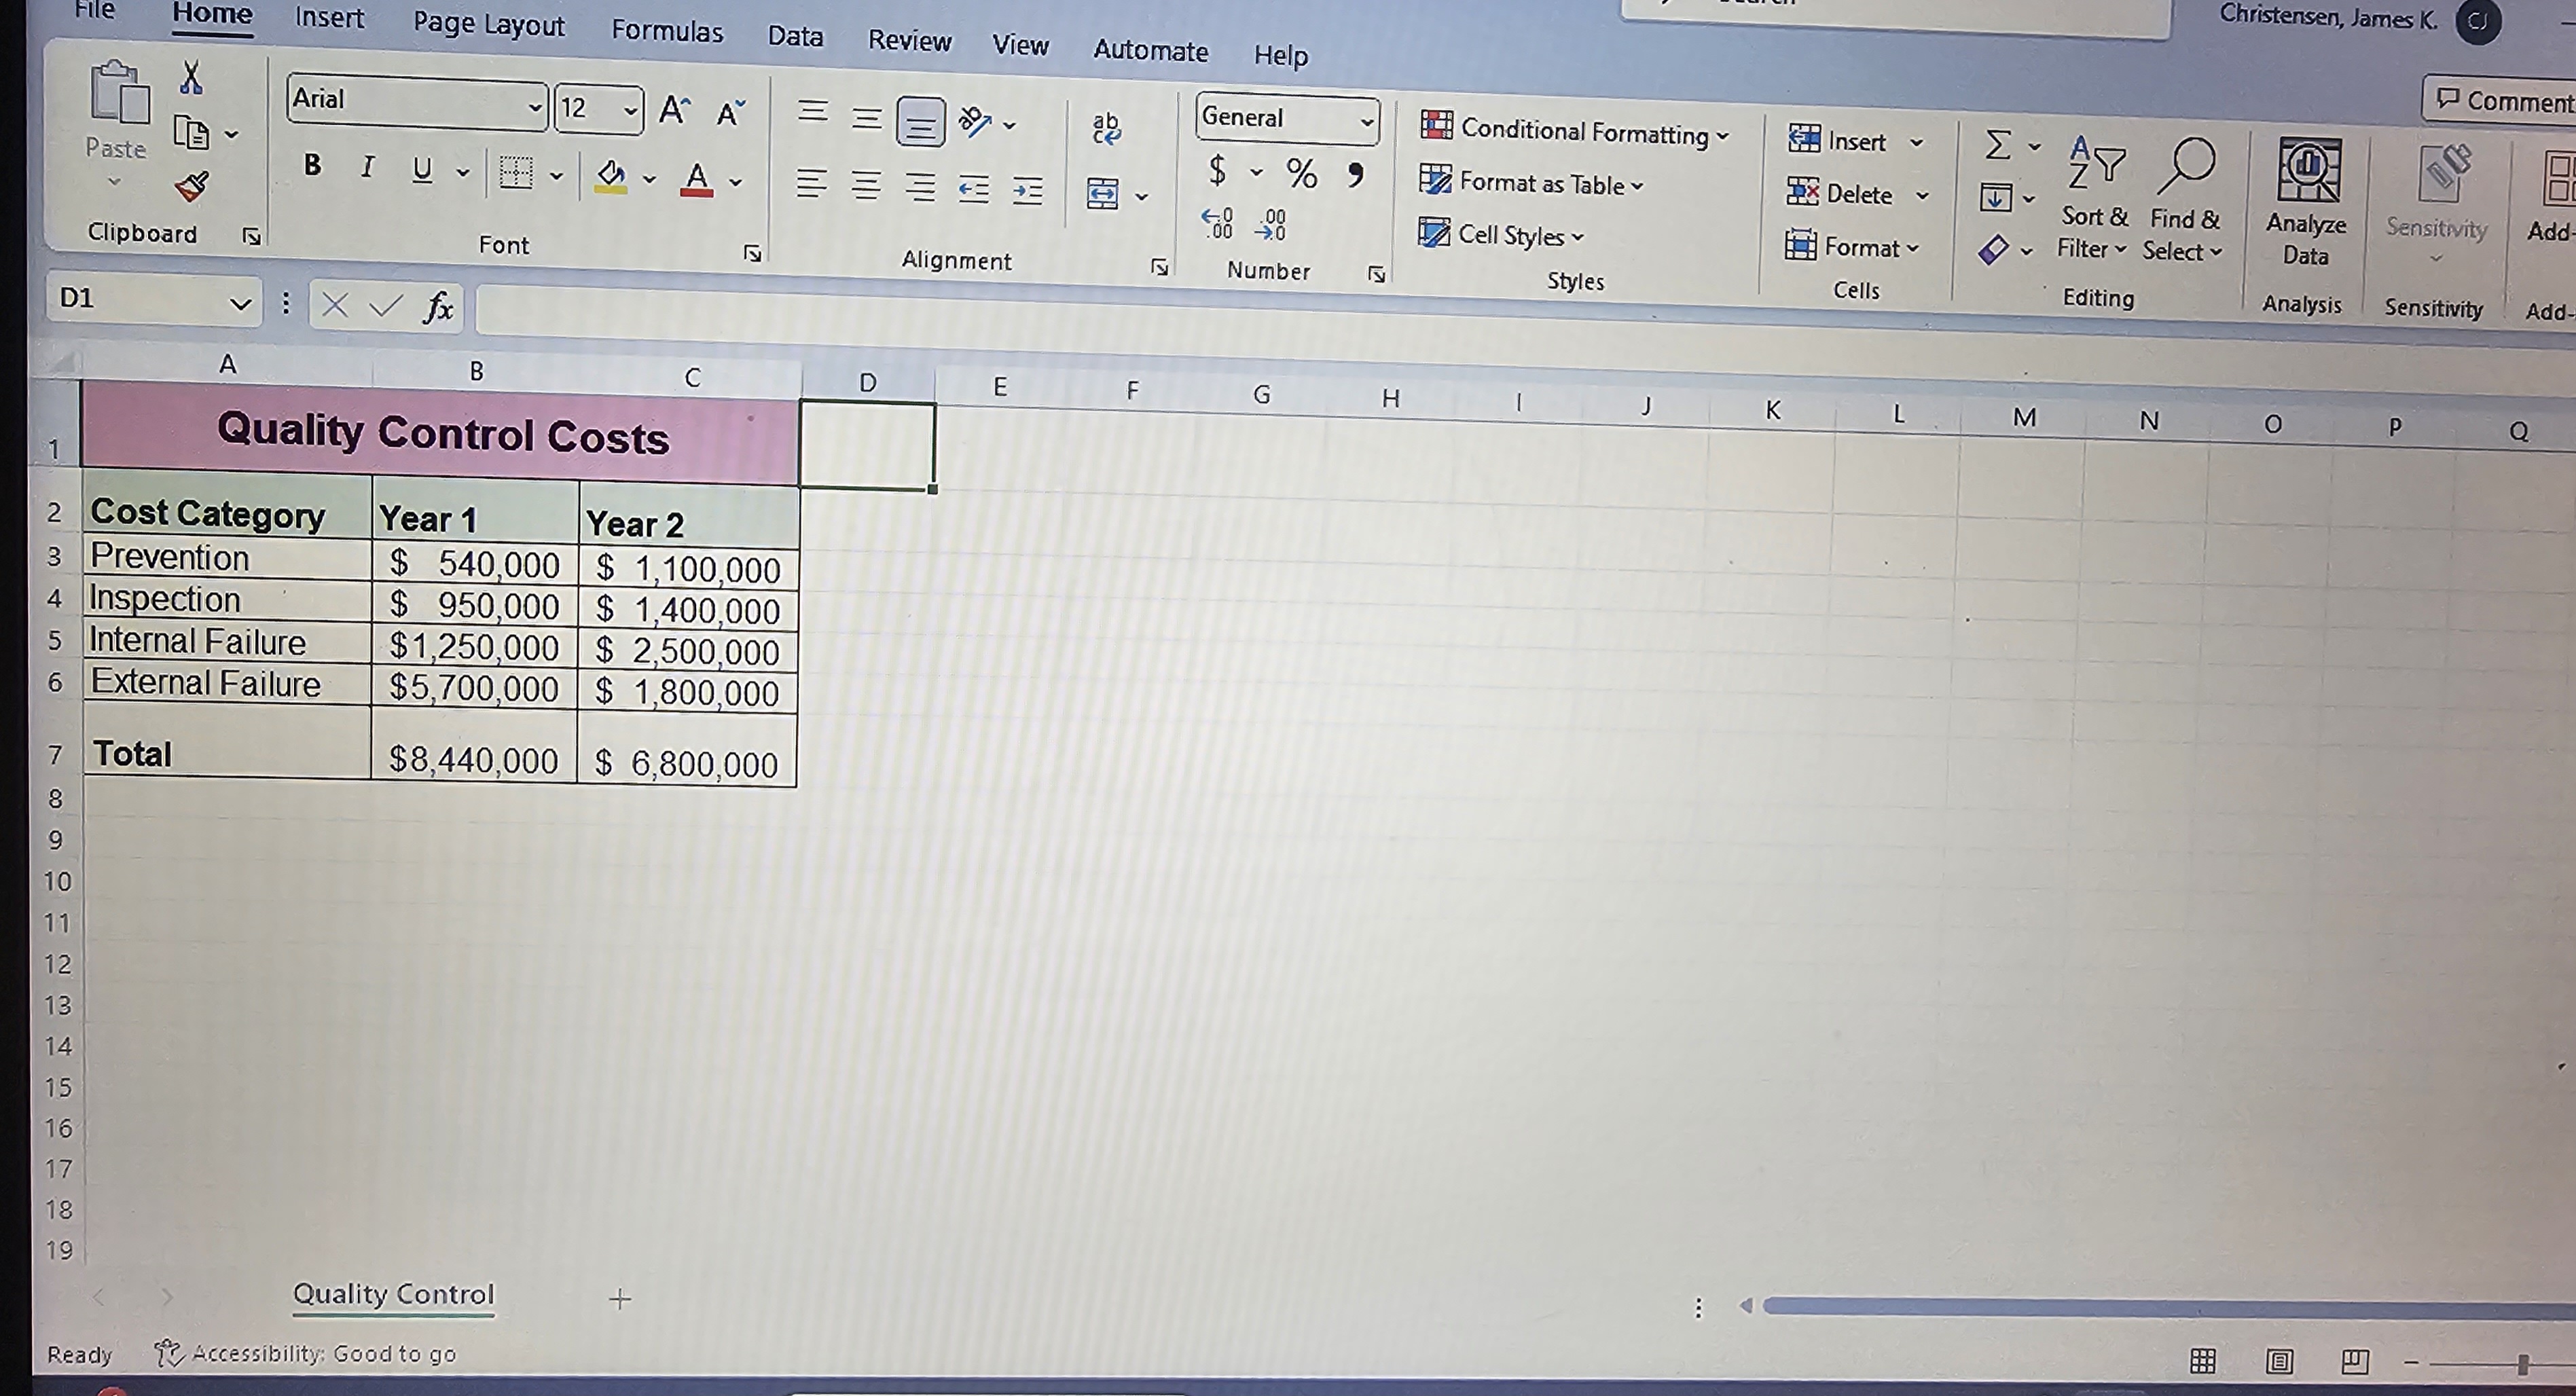
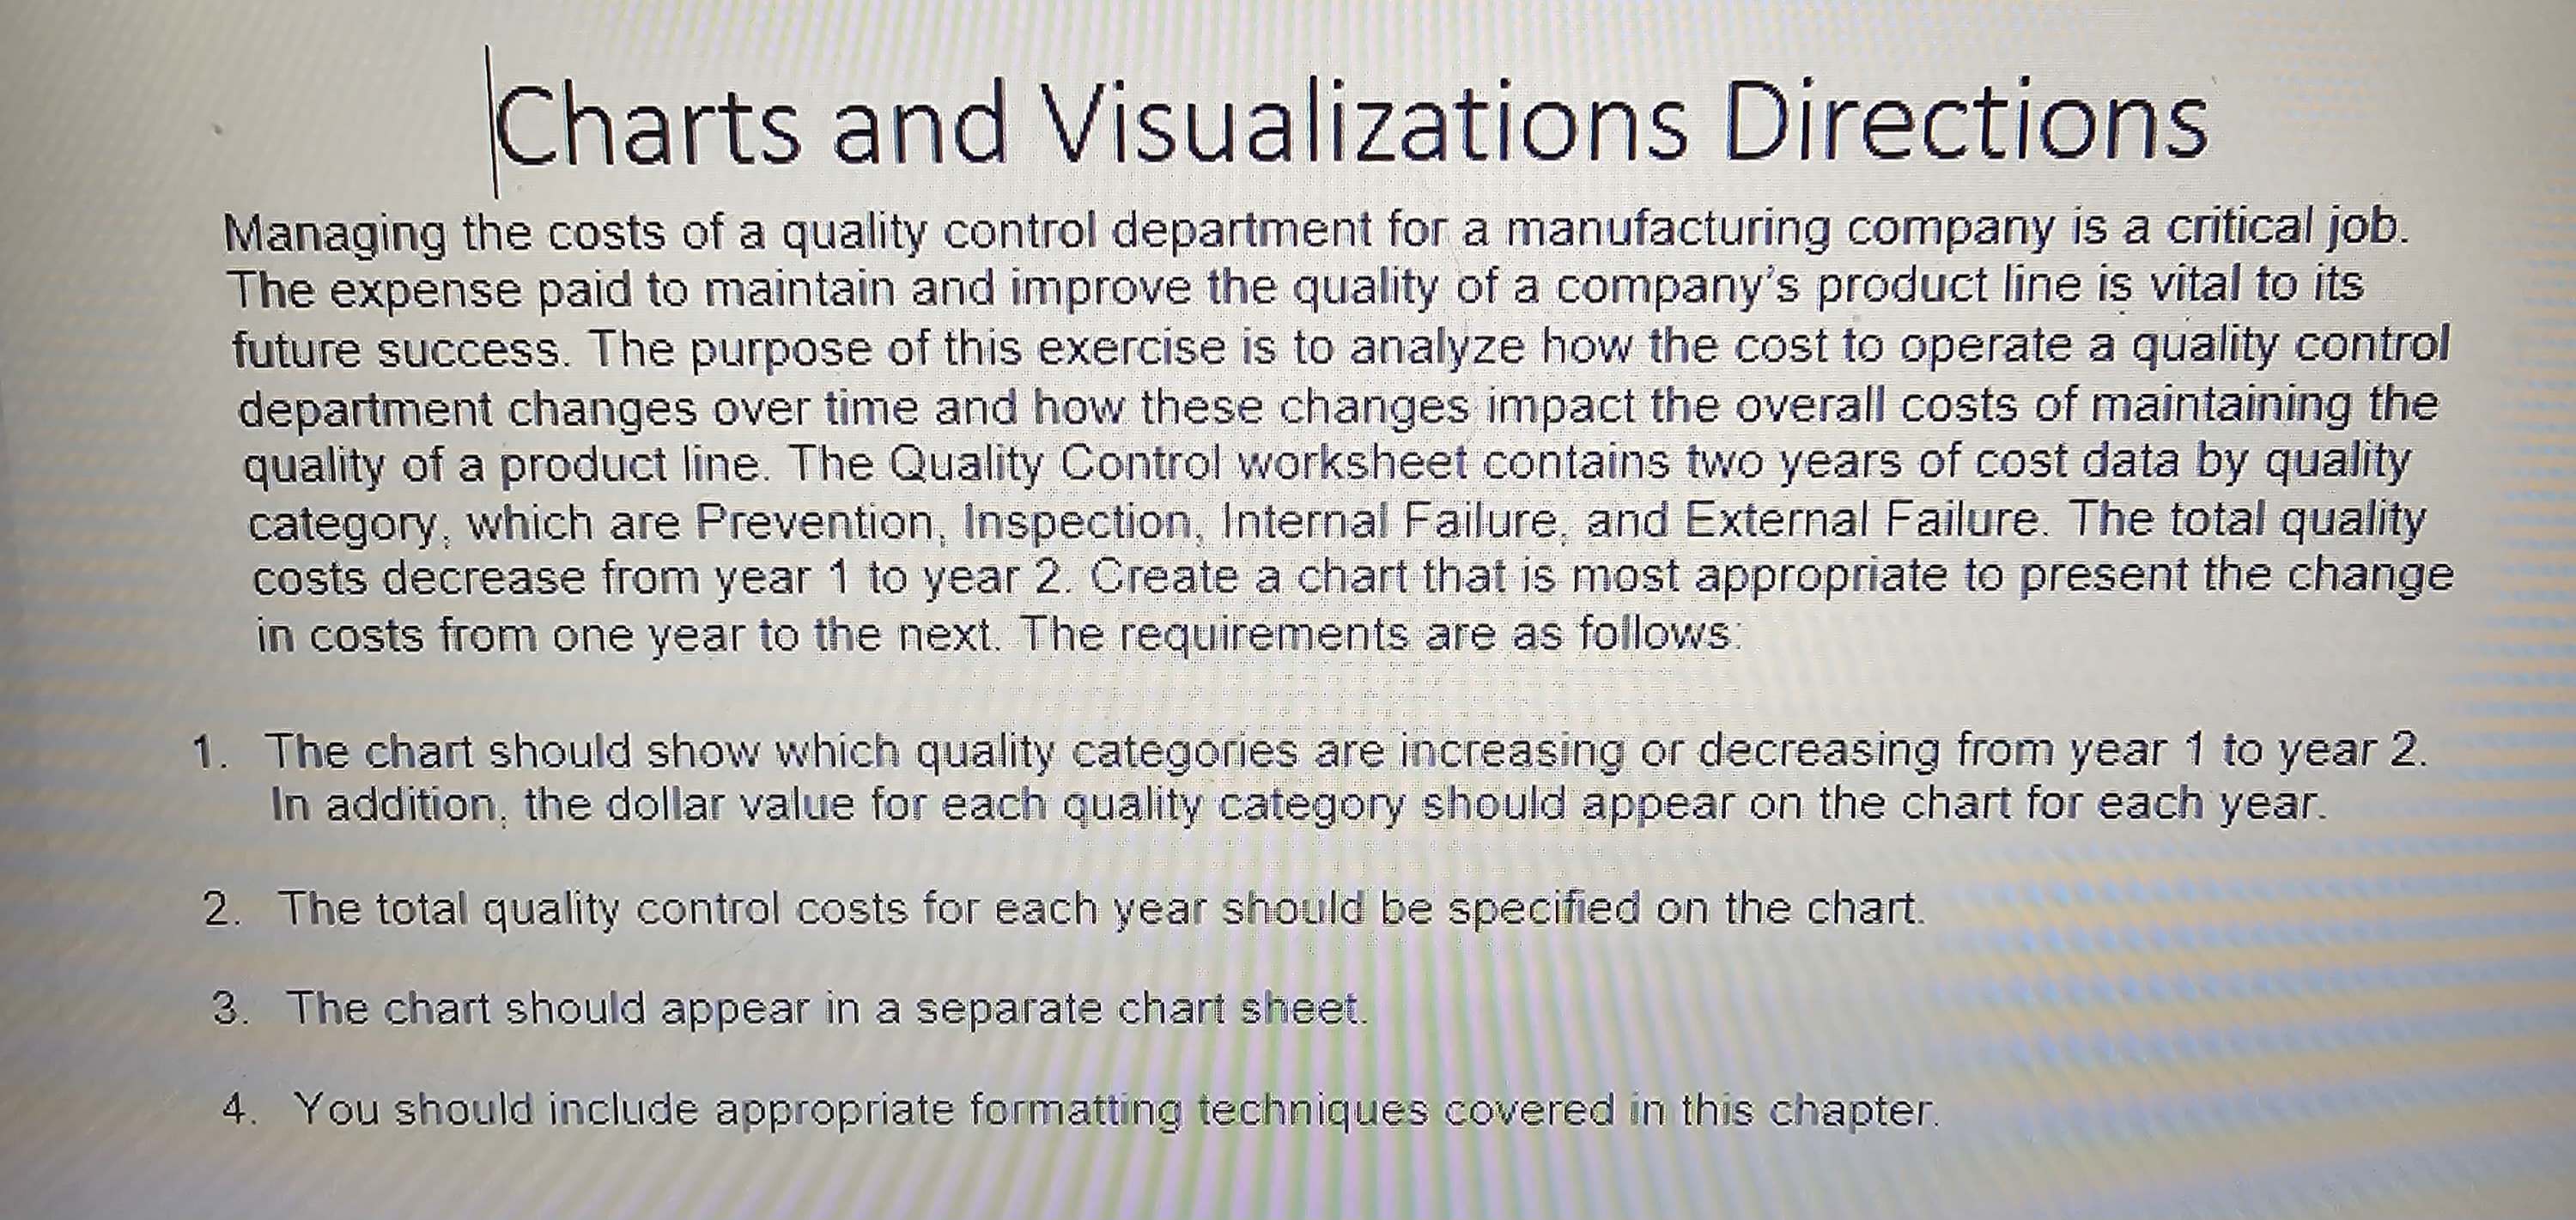 File Home Insert Page Layout Formulas Data Review View Automate Help Christensen, James K. :xfx General D1 Styles C Quality Control Costs 1 \begin{tabular}{|c|c|c|} \hline \multicolumn{3}{|c|}{ Quality Control Costs } \\ \hline Cost Category & Year 1 & Year 2 \\ \hline Prevention & $540,000 & $1,100,000 \\ \hline Inspection & $950,000 & $1,400,000 \\ \hline Internal Failure & $1,250,000 & $2,500,000 \\ \hline External Failure & $5,700,000 & $1,800,000 \\ \hline Total & $8,440,000 & $6,800,000 \\ \hline \end{tabular} \begin{tabular}{|c|c|} \hline 8 & \\ \hline 9 & \\ 10 & \\ 11 & 12 \\ 12 & 13 \\ 14 \\ 15 \\ 16 \\ 17 \\ 18 \\ 19 \end{tabular} D G H J K L M N 0 P Q Quality Control Ready if Accessibility: Good to go Charts and Visualzations Directions Managing the costs of a quality control department for a manufacturing company is a critical job. The expense paid to maintain and improve the quality of a company's product line is vital to its future success. The purpose of this exercise is to analyze how the cost to operate a quality control department changes over time and how these changes impact the overall costs of maintaining the quality of a product line. The Quality Control worksheet contains two years of cost data by quality category, which are Prevention, Inspection, Internal Failure, and External Failure. The total quality costs decrease from year 1 to year 2 . Create a chart that is most appropriate to present the change in costs from one year to the next. The requirements are as follows: 1. The chart should show which quality categories are increasing or decreasing from year 1 to year 2 . In addition, the dollar value for each quality category should appear on the chart for each year. 2. The total quality control costs for each year should be specified on the chart. 3. The chart should appear in a separate chart sheet. 4. You should include appropriate formatting techniques covered in this chapter. File Home Insert Page Layout Formulas Data Review View Automate Help Christensen, James K. :xfx General D1 Styles C Quality Control Costs 1 \begin{tabular}{|c|c|c|} \hline \multicolumn{3}{|c|}{ Quality Control Costs } \\ \hline Cost Category & Year 1 & Year 2 \\ \hline Prevention & $540,000 & $1,100,000 \\ \hline Inspection & $950,000 & $1,400,000 \\ \hline Internal Failure & $1,250,000 & $2,500,000 \\ \hline External Failure & $5,700,000 & $1,800,000 \\ \hline Total & $8,440,000 & $6,800,000 \\ \hline \end{tabular} \begin{tabular}{|c|c|} \hline 8 & \\ \hline 9 & \\ 10 & \\ 11 & 12 \\ 12 & 13 \\ 14 \\ 15 \\ 16 \\ 17 \\ 18 \\ 19 \end{tabular} D G H J K L M N 0 P Q Quality Control Ready if Accessibility: Good to go Charts and Visualzations Directions Managing the costs of a quality control department for a manufacturing company is a critical job. The expense paid to maintain and improve the quality of a company's product line is vital to its future success. The purpose of this exercise is to analyze how the cost to operate a quality control department changes over time and how these changes impact the overall costs of maintaining the quality of a product line. The Quality Control worksheet contains two years of cost data by quality category, which are Prevention, Inspection, Internal Failure, and External Failure. The total quality costs decrease from year 1 to year 2 . Create a chart that is most appropriate to present the change in costs from one year to the next. The requirements are as follows: 1. The chart should show which quality categories are increasing or decreasing from year 1 to year 2 . In addition, the dollar value for each quality category should appear on the chart for each year. 2. The total quality control costs for each year should be specified on the chart. 3. The chart should appear in a separate chart sheet. 4. You should include appropriate formatting techniques covered in this chapter
 Step by Step Solution
There are 3 Steps involved in it
Step: 1

Get Instant Access to Expert-Tailored Solutions
See step-by-step solutions with expert insights and AI powered tools for academic success
Step: 2

Step: 3
Ace Your Homework with AI
Get the answers you need in no time with our AI-driven, step-by-step assistance
Get Started
ACCOUNTING JOB QUESTIONS AND ANSWERS Trainee Accountants Handbook
Authors: Sterling Libs FCCA
1st Edition
1911037129, 978-1911037125