Answered step by step
Verified Expert Solution
Link Copied!

Question

1 Approved Answer

I'm really confused on how to create this in MATLAB A circuit that filters out a certain frequency is shown in the figure. In this

I'm really confused on how to create this in MATLABimage text in transcribed

A circuit that filters out a certain frequency is shown in the figure. In this filter, the ratio of the magnitudes of the voltages is given by: RV=ViVo=(L)2+(RR2LC)2R(12LC) where =2f, and f is the frequency of the input signal. Write a user-defined MATLAB function that calculates the ratio of magnitudes. For the function name and arguments, use RV= filtafreq (R,C,L,f). The input arguments are R the size of the resistor in (ohms); C, the size of the capacitor in F (farad); L, the inductance of the coil in H (henrys); and f, the frequency of the input signal in Hz (hertz). Write the function such that f can be a vector. Write a program in a script file that uses the filtafreq function to generate a figure with two plots of RV as a function of f for 10f100,000; Hz. In one plot C=160F,L= 45mH, and R=200, and in the second plot C and L are unchanged but R=50. The plot has a logarithmic scale on the horizontal axis. Label the axes and display a legend

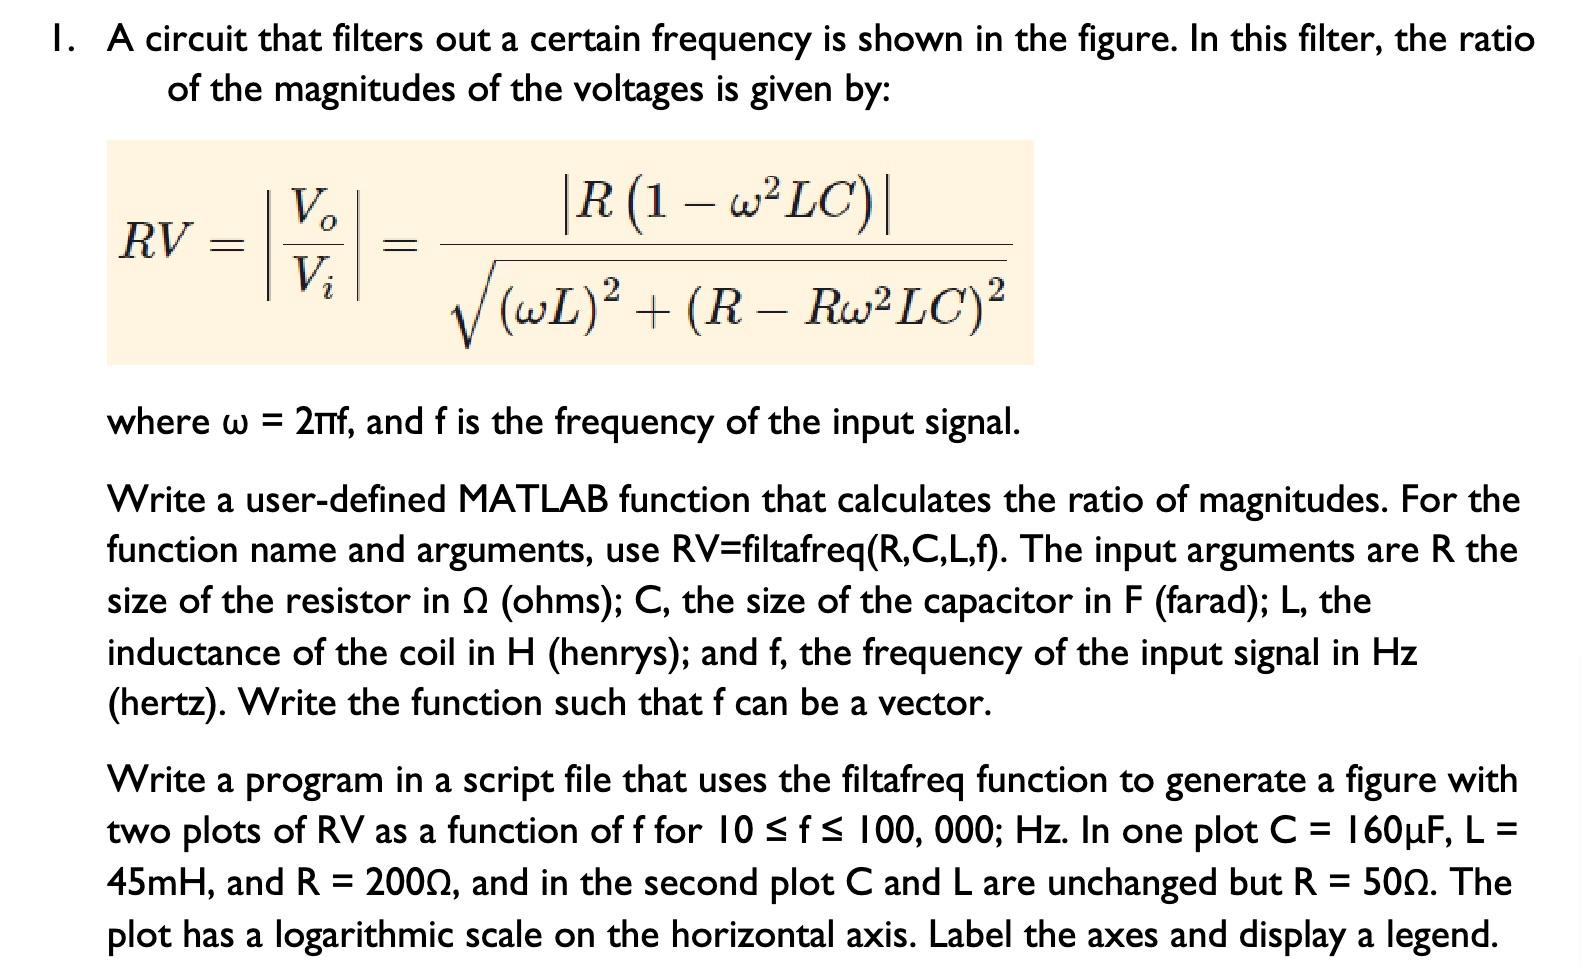
Step by Step Solution

There are 3 Steps involved in it

Step: 1

blur-text-image

Get Instant Access to Expert-Tailored Solutions

See step-by-step solutions with expert insights and AI powered tools for academic success

Step: 2

blur-text-image

Step: 3

blur-text-image

Ace Your Homework with AI

Get the answers you need in no time with our AI-driven, step-by-step assistance

Get Started

Recommended Textbook for

Big Data, Mining, And Analytics Components Of Strategic Decision Making

Authors: Stephan Kudyba

1st Edition

1466568704, 9781466568709

More Books

Students also viewed these Databases questions