Question
I'm struggling to find formulas that work with the information I am given. I am asked to find the Kd, Ke, Wd, We , and
I'm struggling to find formulas that work with the information I am given.
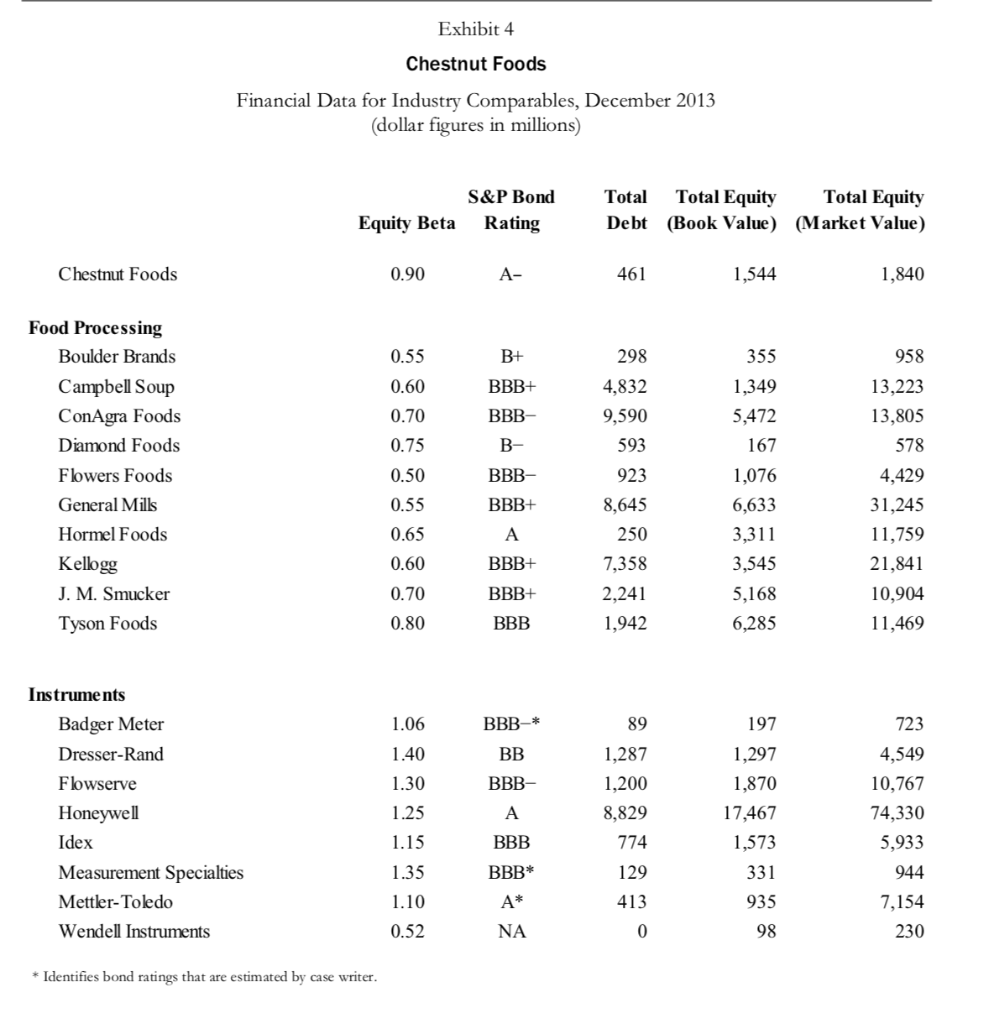
I am asked to find the Kd, Ke, Wd, We, and WACC for each of the foods in this list.

Here are some exhibits I was provided with:


Here are a few instructions I was provided with:
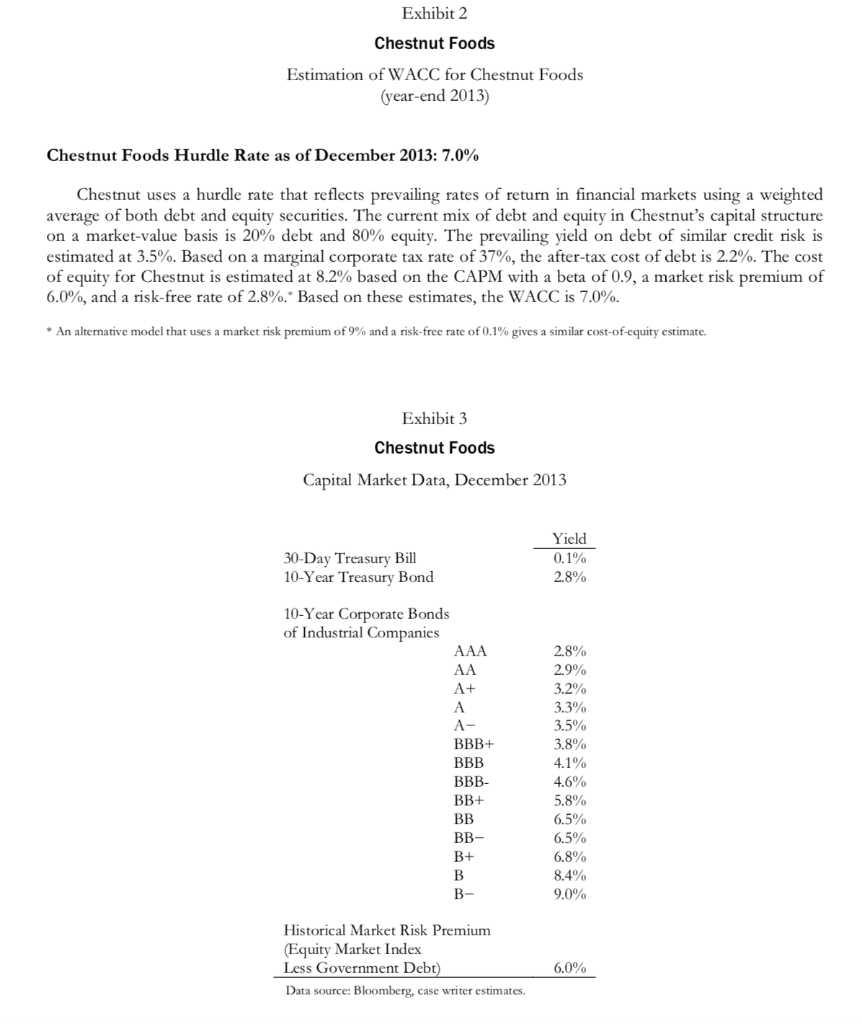
1. You can use the firms' bond ratings to estimate the pre-tax cost of debt.
2. You can use the Capital Asset Pricing Model (CAPM) to estimate the cost of equity.
3. The weights must sum to 1.00. Recall that Wd = D / (D + E) and We = E / (D + E)
4. Recall that the WACC is an after-tax number. The tax rate is provided in the case. Assume all firms have the same marginal tax rate.
5. Answer the discussion questions (below) after completing your computations.
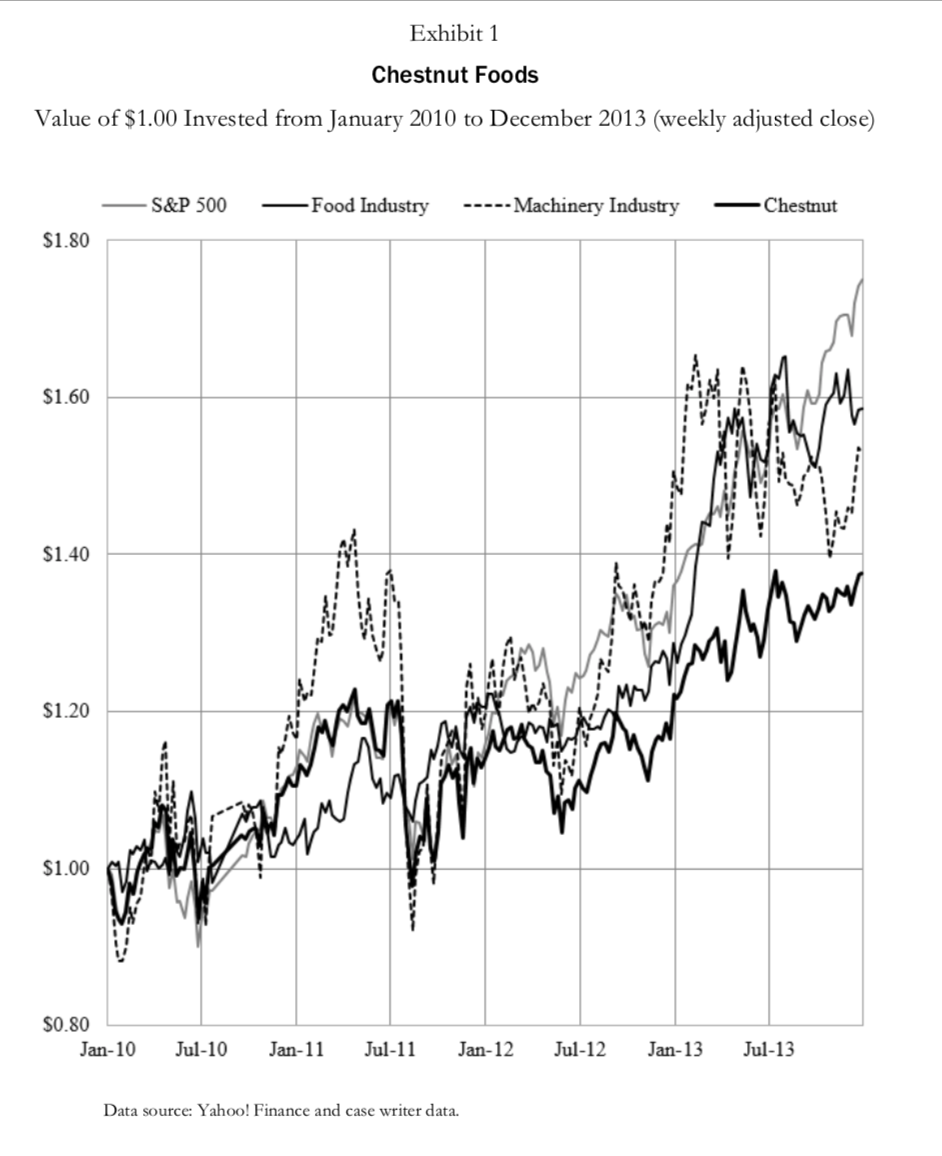
Exhibit 4 Chestnut Foods Financial Data for Industry Comparables, December 2013 (dollar figures in millions) S&P Bond Rating Total Total Equity Total Equity Debt (Book Value) (Market Value) Equity Beta Chestnut Foods 0.90 A- 461 1,544 1,840 B+ BBB+ BBB- B- Food Processing Boulder Brands Campbell Soup ConAgra Foods Diamond Foods Flowers Foods General Mills Hormel Foods Kellogg J. M. Smucker Tyson Foods BBB- 0.55 0.60 0.70 0.75 0.50 0.55 0.65 0.60 0.70 0.80 298 4,832 9,590 593 923 8,645 250 7,358 2,241 1,942 355 1,349 5,472 167 1,076 6,633 3,311 3,545 5,168 6,285 958 13,223 13,805 578 4,429 31,245 11,759 21,841 10,904 11,469 BBB+ BBB+ BBB+ BBB BBB-* 89 1.06 1.40 1.30 1.25 1.15 BB BBB- Instruments Badger Meter Dresser-Rand Flowserve Honeywell Idex Measurement Specialties Mettler-Toledo Wendell Instruments 1,287 1,200 8,829 197 1,297 1,870 17,467 1,573 723 4,549 10,767 74,330 5,933 944 7,154 230 BBB 774 1.35 BBB* 331 129 413 4* 935 1.10 0.52 NA 98 * Identifies bond ratings that are estimated by case writer. Exhibit 1 Chestnut Foods Value of $1.00 Invested from January 2010 to December 2013 (weekly adjusted close) S&P 500 - Food Industry -----Machinery Industry Chestnut $1.80 $1.60 $1.40 ! $1.20 M wie MIM Viny $1.00 MINYV my with $0.80 Jan-10 Jul-10 Jan-11 Jul-11 Jan-12 Jul-12 Jan-13 Jul-13 Data source: Yahoo! Finance and case writer data. Exhibit 2 Chestnut Foods Estimation of WACC for Chestnut Foods (year-end 2013) Chestnut Foods Hurdle Rate as of December 2013: 7.0% Chestnut uses a hurdle rate that reflects prevailing rates of return in financial markets using a weighted average of both debt and equity securities. The current mix of debt and equity in Chestnut's capital structure on a market value basis is 20% debt and 80% equity. The prevailing yield on debt of similar credit risk is estimated at 3.5%. Based on a marginal corporate tax rate of 37%, the after-tax cost of debt is 2.2%. The cost of equity for Chestnut is estimated at 8.2% based on the CAPM with a beta of 0.9, a market risk premium of 6.0%, and a risk-free rate of 2.8%.* Based on these estimates, the WACC is 7.0%. * An alternative model that uses a market risk premium of 9% and a risk-free rate of 0.1% gives a similar cost-of-equity estimate. Exhibit 3 Chestnut Foods Capital Market Data, December 2013 30-Day Treasury Bill 10-Year Treasury Bond Yield 0.1% 2.8% 10-Year Corporate Bonds of Industrial Companies AAA A+ A- BBB+ BBB BBB- BB+ BB BB- 2.8% 2.9% 3.2% 3.3% 3.5% 3.8% 4.1% 4.6% 5.8% 6.5% 6.5% 6.8% 8.4% 9.0% B+ B- Historical Market Risk Premium (Equity Market Index Less Government Debt) Data source: Bloomberg, case writer estimates. 6.0% Exhibit 4 Chestnut Foods Financial Data for Industry Comparables, December 2013 (dollar figures in millions) S&P Bond Rating Total Total Equity Total Equity Debt (Book Value) (Market Value) Equity Beta Chestnut Foods 0.90 A- 461 1,544 1,840 B+ BBB+ BBB- B- Food Processing Boulder Brands Campbell Soup ConAgra Foods Diamond Foods Flowers Foods General Mills Hormel Foods Kellogg J. M. Smucker Tyson Foods BBB- 0.55 0.60 0.70 0.75 0.50 0.55 0.65 0.60 0.70 0.80 298 4,832 9,590 593 923 8,645 250 7,358 2,241 1,942 355 1,349 5,472 167 1,076 6,633 3,311 3,545 5,168 6,285 958 13,223 13,805 578 4,429 31,245 11,759 21,841 10,904 11,469 BBB+ BBB+ BBB+ BBB BBB-* 89 1.06 1.40 1.30 1.25 1.15 BB BBB- Instruments Badger Meter Dresser-Rand Flowserve Honeywell Idex Measurement Specialties Mettler-Toledo Wendell Instruments 1,287 1,200 8,829 197 1,297 1,870 17,467 1,573 723 4,549 10,767 74,330 5,933 944 7,154 230 BBB 774 1.35 BBB* 331 129 413 4* 935 1.10 0.52 NA 98 * Identifies bond ratings that are estimated by case writer. Exhibit 1 Chestnut Foods Value of $1.00 Invested from January 2010 to December 2013 (weekly adjusted close) S&P 500 - Food Industry -----Machinery Industry Chestnut $1.80 $1.60 $1.40 ! $1.20 M wie MIM Viny $1.00 MINYV my with $0.80 Jan-10 Jul-10 Jan-11 Jul-11 Jan-12 Jul-12 Jan-13 Jul-13 Data source: Yahoo! Finance and case writer data. Exhibit 2 Chestnut Foods Estimation of WACC for Chestnut Foods (year-end 2013) Chestnut Foods Hurdle Rate as of December 2013: 7.0% Chestnut uses a hurdle rate that reflects prevailing rates of return in financial markets using a weighted average of both debt and equity securities. The current mix of debt and equity in Chestnut's capital structure on a market value basis is 20% debt and 80% equity. The prevailing yield on debt of similar credit risk is estimated at 3.5%. Based on a marginal corporate tax rate of 37%, the after-tax cost of debt is 2.2%. The cost of equity for Chestnut is estimated at 8.2% based on the CAPM with a beta of 0.9, a market risk premium of 6.0%, and a risk-free rate of 2.8%.* Based on these estimates, the WACC is 7.0%. * An alternative model that uses a market risk premium of 9% and a risk-free rate of 0.1% gives a similar cost-of-equity estimate. Exhibit 3 Chestnut Foods Capital Market Data, December 2013 30-Day Treasury Bill 10-Year Treasury Bond Yield 0.1% 2.8% 10-Year Corporate Bonds of Industrial Companies AAA A+ A- BBB+ BBB BBB- BB+ BB BB- 2.8% 2.9% 3.2% 3.3% 3.5% 3.8% 4.1% 4.6% 5.8% 6.5% 6.5% 6.8% 8.4% 9.0% B+ B- Historical Market Risk Premium (Equity Market Index Less Government Debt) Data source: Bloomberg, case writer estimates. 6.0%Step by Step Solution
There are 3 Steps involved in it
Step: 1

Get Instant Access to Expert-Tailored Solutions
See step-by-step solutions with expert insights and AI powered tools for academic success
Step: 2

Step: 3

Ace Your Homework with AI
Get the answers you need in no time with our AI-driven, step-by-step assistance
Get Started


